NAME
Chart::Plotly::Trace::Candlestick - The candlestick is a style of financial chart describing open, high, low and close for a given `x` coordinate (most likely time). The boxes represent the spread between the `open` and `close` values and the lines represent the spread between the `low` and `high` values Sample points where the close value is higher (lower) then the open value are called increasing (decreasing). By default, increasing candles are drawn in green whereas decreasing are drawn in red.
VERSION
version 0.042
SYNOPSIS
 use Chart::Plotly;
 use Chart::Plotly::Trace::Candlestick;
 my $candlestick = Chart::Plotly::Trace::Candlestick->new(
     x     => [ 1 .. 5 ],
     open  => [ 1, 6, 7 ],
     close => [ 7, 12, 5 ],
     high  => [ 8, 15, 10 ],
     low   => [ 0.5, 5, 4 ]
 );

 Chart::Plotly::show_plot([$candlestick]);
DESCRIPTION
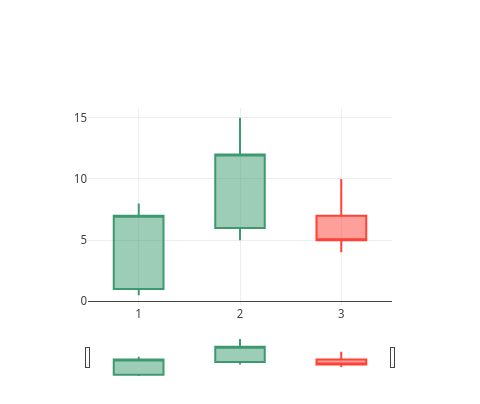
The candlestick is a style of financial chart describing open, high, low and close for a given `x` coordinate (most likely time). The boxes represent the spread between the `open` and `close` values and the lines represent the spread between the `low` and `high` values Sample points where the close value is higher (lower) then the open value are called increasing (decreasing). By default, increasing candles are drawn in green whereas decreasing are drawn in red.
Screenshot of the above example:
This file has been autogenerated from the official plotly.js source.
If you like Plotly, please support them: https://plot.ly/ Open source announcement: https://plot.ly/javascript/open-source-announcement/
Full reference: https://plot.ly/javascript/reference/#candlestick
DISCLAIMER
This is an unofficial Plotly Perl module. Currently I'm not affiliated in any way with Plotly. But I think plotly.js is a great library and I want to use it with perl.
METHODS
TO_JSON
Serialize the trace to JSON. This method should be called only by JSON serializer.
type
Trace type.
ATTRIBUTES
close
Sets the close values.
closesrc
Sets the source reference on Chart Studio Cloud for `close`.
customdata
Assigns extra data each datum. This may be useful when listening to hover, click and selection events. Note that, *scatter* traces also appends customdata items in the markers DOM elements
customdatasrc
Sets the source reference on Chart Studio Cloud for `customdata`.
decreasing
high
Sets the high values.
highsrc
Sets the source reference on Chart Studio Cloud for `high`.
hoverinfo
Determines which trace information appear on hover. If `none` or `skip` are set, no information is displayed upon hovering. But, if `none` is set, click and hover events are still fired.
hoverinfosrc
Sets the source reference on Chart Studio Cloud for `hoverinfo`.
hoverlabel
hovertext
Same as `text`.
hovertextsrc
Sets the source reference on Chart Studio Cloud for `hovertext`.
ids
Assigns id labels to each datum. These ids for object constancy of data points during animation. Should be an array of strings, not numbers or any other type.
idssrc
Sets the source reference on Chart Studio Cloud for `ids`.
increasing
legendgroup
Sets the legend group for this trace. Traces part of the same legend group hide/show at the same time when toggling legend items.
legendgrouptitle
legendrank
Sets the legend rank for this trace. Items and groups with smaller ranks are presented on top/left side while with `*reversed* `legend.traceorder` they are on bottom/right side. The default legendrank is 1000, so that you can use ranks less than 1000 to place certain items before all unranked items, and ranks greater than 1000 to go after all unranked items.
line
low
Sets the low values.
lowsrc
Sets the source reference on Chart Studio Cloud for `low`.
pmeta
Assigns extra meta information associated with this trace that can be used in various text attributes. Attributes such as trace `name`, graph, axis and colorbar `title.text`, annotation `text` `rangeselector`, `updatemenues` and `sliders` `label` text all support `meta`. To access the trace `meta` values in an attribute in the same trace, simply use `%{meta[i]}` where `i` is the index or key of the `meta` item in question. To access trace `meta` in layout attributes, use `%{data[n[.meta[i]}` where `i` is the index or key of the `meta` and `n` is the trace index.
metasrc
Sets the source reference on Chart Studio Cloud for `meta`.
name
Sets the trace name. The trace name appear as the legend item and on hover.
opacity
Sets the opacity of the trace.
open
Sets the open values.
opensrc
Sets the source reference on Chart Studio Cloud for `open`.
selectedpoints
Array containing integer indices of selected points. Has an effect only for traces that support selections. Note that an empty array means an empty selection where the `unselected` are turned on for all points, whereas, any other non-array values means no selection all where the `selected` and `unselected` styles have no effect.
showlegend
Determines whether or not an item corresponding to this trace is shown in the legend.
stream
text
Sets hover text elements associated with each sample point. If a single string, the same string appears over all the data points. If an array of string, the items are mapped in order to this trace's sample points.
textsrc
Sets the source reference on Chart Studio Cloud for `text`.
transforms
uid
Assign an id to this trace, Use this to provide object constancy between traces during animations and transitions.
uirevision
Controls persistence of some user-driven changes to the trace: `constraintrange` in `parcoords` traces, as well as some `editable: true` modifications such as `name` and `colorbar.title`. Defaults to `layout.uirevision`. Note that other user-driven trace attribute changes are controlled by `layout` attributes: `trace.visible` is controlled by `layout.legend.uirevision`, `selectedpoints` is controlled by `layout.selectionrevision`, and `colorbar.(x|y)` (accessible with `config: {editable: true}`) is controlled by `layout.editrevision`. Trace changes are tracked by `uid`, which only falls back on trace index if no `uid` is provided. So if your app can add/remove traces before the end of the `data` array, such that the same trace has a different index, you can still preserve user-driven changes if you give each trace a `uid` that stays with it as it moves.
visible
Determines whether or not this trace is visible. If *legendonly*, the trace is not drawn, but can appear as a legend item (provided that the legend itself is visible).
whiskerwidth
Sets the width of the whiskers relative to the box' width. For example, with 1, the whiskers are as wide as the box(es).
x
Sets the x coordinates. If absent, linear coordinate will be generated.
xaxis
Sets a reference between this trace's x coordinates and a 2D cartesian x axis. If *x* (the default value), the x coordinates refer to `layout.xaxis`. If *x2*, the x coordinates refer to `layout.xaxis2`, and so on.
xcalendar
Sets the calendar system to use with `x` date data.
xhoverformat
Sets the hover text formatting rulefor `x` using d3 formatting mini-languages which are very similar to those in Python. For numbers, see: https://github.com/d3/d3-format/tree/v1.4.5#d3-format. And for dates see: https://github.com/d3/d3-time-format/tree/v2.2.3#locale_format. We add two items to d3's date formatter: *%h* for half of the year as a decimal number as well as *%{n}f* for fractional seconds with n digits. For example, *2016-10-13 09:15:23.456* with tickformat *%H~%M~%S.%2f* would display *09~15~23.46*By default the values are formatted using `xaxis.hoverformat`.
xperiod
Only relevant when the axis `type` is *date*. Sets the period positioning in milliseconds or *n* on the x axis. Special values in the form of *n* could be used to declare the number of months. In this case `n` must be a positive integer.
xperiod0
Only relevant when the axis `type` is *date*. Sets the base for period positioning in milliseconds or date string on the x0 axis. When `x0period` is round number of weeks, the `x0period0` by default would be on a Sunday i.e. 2000-01-02, otherwise it would be at 2000-01-01.
xperiodalignment
Only relevant when the axis `type` is *date*. Sets the alignment of data points on the x axis.
xsrc
Sets the source reference on Chart Studio Cloud for `x`.
yaxis
Sets a reference between this trace's y coordinates and a 2D cartesian y axis. If *y* (the default value), the y coordinates refer to `layout.yaxis`. If *y2*, the y coordinates refer to `layout.yaxis2`, and so on.
yhoverformat
Sets the hover text formatting rulefor `y` using d3 formatting mini-languages which are very similar to those in Python. For numbers, see: https://github.com/d3/d3-format/tree/v1.4.5#d3-format. And for dates see: https://github.com/d3/d3-time-format/tree/v2.2.3#locale_format. We add two items to d3's date formatter: *%h* for half of the year as a decimal number as well as *%{n}f* for fractional seconds with n digits. For example, *2016-10-13 09:15:23.456* with tickformat *%H~%M~%S.%2f* would display *09~15~23.46*By default the values are formatted using `yaxis.hoverformat`.
AUTHOR
Pablo Rodríguez González <pablo.rodriguez.gonzalez@gmail.com>
COPYRIGHT AND LICENSE
This software is Copyright (c) 2022 by Pablo Rodríguez González.
This is free software, licensed under:
The MIT (X11) License