NAME
Chart::Graph::Xrt3d
SYNOPSIS
#Include module
use Chart::Graph::Xrt3d qw(xrt3d);

# Function call
xrt3d(\%options,
      \@data_set
     );
DESCRIPTION
This module is unmaintained, it worked with Sitraka's XRT, and hasn't been tested against newer versions.
Sitraka (now Quest) makes a number of graphics packages for UNIX systems. XRT is a Motif-based commercial software product that has been adapted by CAIDA using a combination of C drivers and Perl function xrt3d(). The Perl function xrt3d() provides access to the three dimensional graphing capabilities of XRT from Perl. To access the two dimensional graphing using XRT, use xrt2d() also supplied in the Chart::Graph package.
ARGUMENTS
The options to xrt3d() are listed below. Additional control over the resulting graph is possible by using the XRT application itself once the graph has been created.
+--------------------------------------------------------------------------+
|                                OPTIONS                                   |
+----------------+--------------------------+------------------------------+
| Name           |  Options                 | Default                      |
|"output file"   |  (set your own)          | "untitled-xrt3d.gif"         |
|"output type"   |  "ps","xwd", "png", "jpg"| "xwd"                        |
|"x-axis title"  |  (set your own)          | "x-axis"                     |
|"y-axis title"  |  (set your own)          | "y-axis"                     |
|"z-axis title"  |  (set your own)          | "z-axis"                     |
|"x-min"         |  "0" or "1"(normally 0)  | "0"                          |
|"y-min"         |  "0" or "1"(normally 0)  | "0"                          |
|"x-step"        |  "0" or "1"(normally 1)  | "1"                          |
|"y-step"        |  "0" or "1"(normally 1)  | "1"                          |
|"x-ticks"       |  (set your own)          | none                         |
|"y-ticks"       |  (set your own)          | none                         |
|"header"        |  (set your own)          | Array ref of "header" text   |
|"footer"        |  (set your own)          | Array ref of "footer" text   |
+----------------+--------------------------+------------------------------+
The xrt3d function only accepts data in one of two forms. The choices are: either [\%data1_opts, \@data_matrix] or [\%data1_opts, "filename"] The data options are listed below.
+--------------------------------------------------------------------------+
|                             DATA OPTIONS                                 |
+----------------+--------------------------+------------------------------+
| Name           |  Options                 | Default                      |
+----------------+--------------------------+------------------------------+
| "type"         | Data format: "matrix" or | none                         |
|                | "file"                   |                              |
+----------------+--------------------------+------------------------------+
DETAILS ON GRAPHICS CONVERTER OPTIONS
The xrt package supports only two graphics formats internally: Postscript and the X windows format XWD. Additional raster graphics formats are supported with Chart::Graph by using one of two graphics converter packages: Imagemagick and Netpbm.
If you need to install a converter package,Imagemagick http://www.imagemagick.org/ is probably preferable simply for its comparatively simplicity. It uses one program convert for all of it's conversion needs, so it is easy to manage and simple for Chart::Graph to use. Many UNIX systems come with some collection of the Netpbm utilities already installed, thus users may be able to start using Chart::Graph without adding any additional converters. Alas, it is unlikely any distributions would include all the converters for the newest graphics formats used by Chart::Graph. In that case it may still preferable to use Imagemagick simply for the sake of avoiding installing over 80 utilities that come with current distributions of Netpbm. For more information on the current distribution of Netpbm go to the current website at: http://netpbm.sourceforge.net/
The xrt package also allows for multiple header and footers with each graph. As a result, instead of just the usual string, an array reference containing the multiple strings for the header and footer text.
EXAMPLES
The following four examples show Chart::Graph::Xrt3d in different roles and producing different styles of output.
EXAMPLE: STOCK PRICES FOR JOE'S RESTAURANT
The first example creates a three dimensional bar chart of fictitious stock data that is displayed in the graphic file xrt3d-1.gif. Note that xrt3d() uses the older gif file format, but can use others as noted above if you have the available converters provided.
 #make sure to include Chart::Graph
 use Chart::Graph::Xrt3d qw(xrt3d);

 #using a 3 by 6 matrix for the data set
 xrt3d({"output file" => "xrt3d-1.gif",
			   "output type" => "gif",
				   "header" =>
			   ["Stock prices for Joe's restaurant chain",
				"Compiled from local records"
				],
			   "footer" =>
			   ["Joe's Restaurant"],
			   "y-ticks"=>["Jan/Feb", "Mar/Apr", "May/Jun", "Jul/Aug",
						   "Sep/Oct", "Nov/Dec"],
			   "x-axis title" => "Years monitored",
			   "y-axis title" => "Month's tracked",
			   "z-axis title" => "Stock prices",
			  },
			  [{"type" => "matrix"},
               ["4", "5", "3", "6", "6", "5"],
			   ["8", "13", "20", "45", "100", "110" ],
			   ["70", "45", "10", "5", "4", "3"]])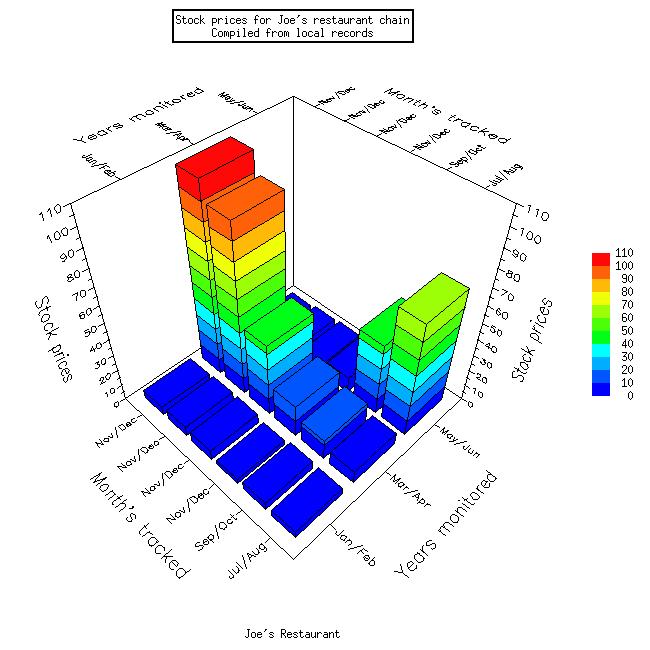
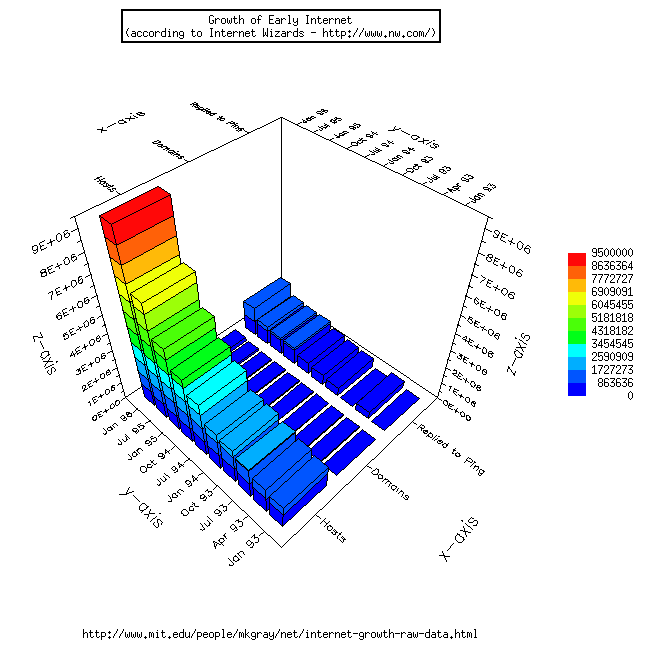
EXAMPLE: EARLY GROWTH OF THE INTERNET
The following example creates a three dimensional bar chart of data collected on the early growth of the Internet (URL and corporate source included on graph.) The result in this case is display in one of the newest graphics formats the PNG format: xrt3d-2.png.
 #make sure to include Chart::Graph
 use Chart::Graph::Xrt3d qw(xrt3d);

  xrt3d({"output file" => "xrt3d-2.png",
         "output type" => "png",
	 "header" =>
	 ["Growth of Early Internet",
	 "(according to Internet Wizards - http://www.nw.com/)",
	 ],
	 "footer" =>
	 ["http://www.mit.edu/people/mkgray/net/internet-growth-raw-data.html"],
	 "y-ticks"=>["Jan 93", "Apr 93", "Jul 93",
		     "Oct 93", "Jan 94", "Jul 94",
		     "Oct 94", "Jan 95", "Jul 95",
		     "Jan 96"
		    ],
	 "x-ticks"=>["Hosts", "Domains", "Replied to Ping"],},
	 [{"type" => "matrix"},
      ["1.3e6", "1.5e6", "1.8e6", "2.1e6", "2.2e6", "3.2e6",
	   "3.9e6","4.9e6", "6.6e6", "9.5e6"
	  ],
	  ["21000","22000", "26000", "28000", "30000", "46000",
	   "56000", "71000", "120000", "240000"
	  ],
	  ["NA", "0.4e6", "NA", "0.5e6", "0.6e6", "0.7e6",
	   "1.0e6", "1.0e6", "1.1e6", "1.7e6"
	  ]
	 ]
        );
EXAMPLE: USING A DATA FILE FOR INPUT
The next example uses a file instead of a array for it's data source. The file is listed below the Perl code.
 #make sure to include Chart::Graph
 use Chart::Graph::Xrt3d qw(xrt3d);

    if (xrt3d({"output file" => "xrt3d-3.gif",
               "output type" => "gif",
               "x-ticks"=>["a", "b", "c"],
	       "y-ticks"=>["w", "x", "y", "z"],},
	    [{"type" => "file"},
		 "xrt3d_data.txt"])) {
	print "ok\n";
    } else {
	print "not ok\n";
    }
The data file used in the above example is as follows.
10 15 23  10
4 13 35 45
29 15 64 24
MORE INFO
For more information on XRT:
http://www.quest.com/xrt_pds/CONTACT
Send email to graph-dev@caida.org is you have problems, questions, or comments. To subscribe to the mailing list send mail to graph-dev-request@caida.org with a body of "subscribe your@email.com"
AUTHOR
CAIDA Perl development team (cpan@caida.org)