NAME
Chart::Plotly - Generate html/javascript charts from perl data using javascript library plotly.js
VERSION
version 0.042
SYNOPSIS
use Chart::Plotly 'show_plot';

my $data = { x    => [ 1 .. 10 ],
             mode => 'markers',
             type => 'scatter'
};
$data->{'y'} = [ map { rand 10 } @{ $data->{'x'} } ];

show_plot([$data]);

use aliased 'Chart::Plotly::Trace::Scattergl';

my $big_array = [ 1 .. 10000 ];
my $scattergl = Scattergl->new( x => $big_array, y => [ map { rand 100 } @$big_array ] );

show_plot([$scattergl]);

use Chart::Plotly qw(show_plot);
use PDL;

use aliased 'Chart::Plotly::Trace::Surface';

my $size = 25;
my $x    = ( xvals zeroes $size+ 1, $size + 1 ) / $size;
my $y    = ( yvals zeroes $size+ 1, $size + 1 ) / $size;
my $z    = 0.5 + 0.5 * ( sin( $x * 6.3 ) * sin( $y * 6.3 ) )**3;    # Bumps

my $surface = Surface->new( x => $x, y => $y, z => $z );

show_plot([$surface]);

use PDL::Math;

my $bessel_size = 50;
my $bessel      = Surface->new(
    x => xvals($bessel_size),
    y => xvals($bessel_size),
    z => bessj0( rvals( zeroes( $bessel_size, $bessel_size ) ) / 2 )
);

show_plot([$bessel]);
DESCRIPTION
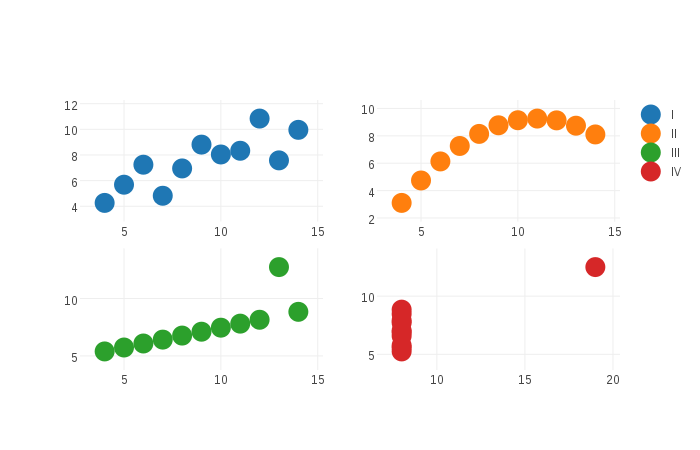
Generate html/javascript charts from perl data using javascript library plotly.js. The result is a file that you could see in your favourite browser.
Example screenshot of plot generated with examples/anscombe.pl:
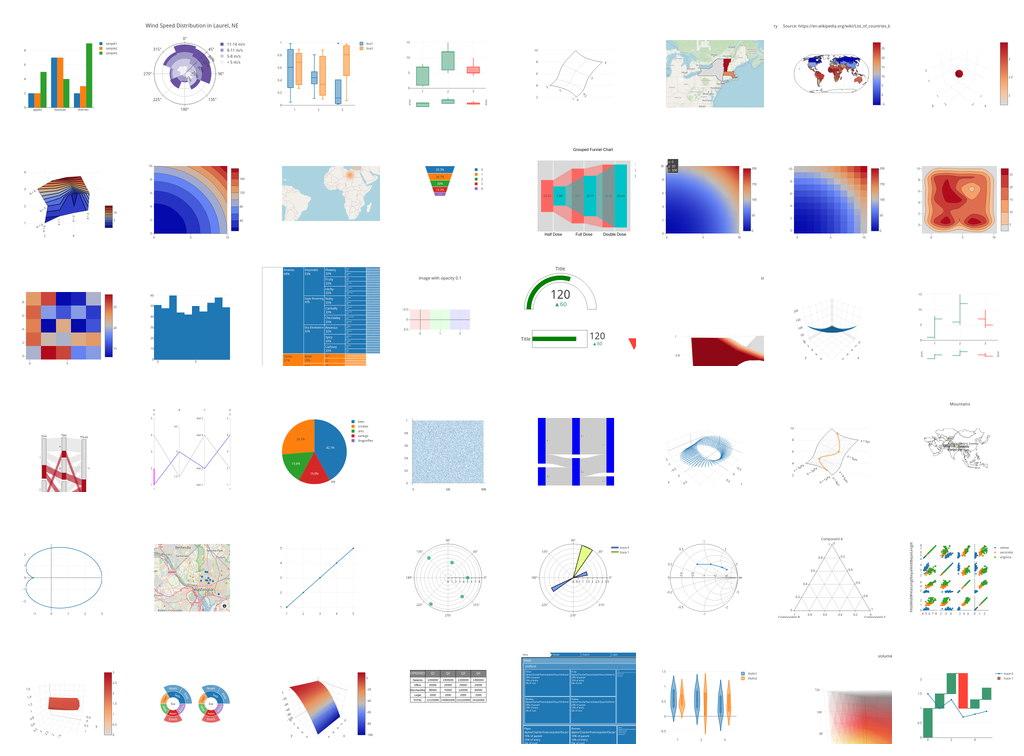
Example screenshot of plots generated with examples/traces/*.pl:
The API is subject to changes.
FUNCTIONS
render_full_html
Parameters
data:
Data to be represented. It could be:
- Perl data structure of the json expected by plotly.js: http://plot.ly/javascript/reference/ (this data would be serialized to JSON)
- Array ref of objects of type Chart::Plotly::Trace::*
- Anything that could be serialized to JSON with the json expected by plotly.js
- Object that could be adapted using Chart::Plotly::Adapter::*
html_plot
Return the html for the plot or plots
Parameters
Data to be represented. The format is the same as the parameter data in render_full_html. Accepts multiple traces/plots/objects.
show_plot
Opens the plot or plots in a browser locally
Parameters
Data to be represented. The format is the same as the parameter data in render_full_html. Accepts multiple traces/plots/objects.
plotlyjs_version
Returns the version of plotly.js using in this version of the perl module as a string
plotlyjs_plot_function
Returns the name of function of plotly.js used in this version of the perl module to draw plots
plotlyjs_plot_function_parameters
Returns the function parameters of the function of plotly.js used in this version of the perl module to draw plots as a list of strings
BUGS
Please report any bugs or feature requests via github: https://github.com/pablrod/p5-Chart-Plotly/issues
DISCLAIMER
This is an unofficial Plotly Perl module. Currently I'm not affiliated in any way with Plotly. But I think plotly.js is a great library and I want to use it with perl.
If you like plotly.js please consider supporting them purchasing a pro subscription: https://plot.ly/products/cloud/
AUTHOR
Pablo Rodríguez González <pablo.rodriguez.gonzalez@gmail.com>
COPYRIGHT AND LICENSE
This software is Copyright (c) 2022 by Pablo Rodríguez González.
This is free software, licensed under:
The MIT (X11) LicenseCONTRIBUTORS
Roy Storey <kiwiroy@users.noreply.github.com>
stphnlyd <stephanloyd9@gmail.com>
weatherwax <s.g.lobo@hotmail.com>