NAME
Chart::Plotly::Trace::Box - Each box spans from quartile 1 (Q1) to quartile 3 (Q3). The second quartile (Q2, i.e. the median) is marked by a line inside the box. The fences grow outward from the boxes' edges, by default they span +/- 1.5 times the interquartile range (IQR: Q3-Q1), The sample mean and standard deviation as well as notches and the sample, outlier and suspected outliers points can be optionally added to the box plot. The values and positions corresponding to each boxes can be input using two signatures. The first signature expects users to supply the sample values in the `y` data array for vertical boxes (`x` for horizontal boxes). By supplying an `x` (`y`) array, one box per distinct `x` (`y`) value is drawn If no `x` (`y`) {array} is provided, a single box is drawn. In this case, the box is positioned with the trace `name` or with `x0` (`y0`) if provided. The second signature expects users to supply the boxes corresponding Q1, median and Q3 statistics in the `q1`, `median` and `q3` data arrays respectively. Other box features relying on statistics namely `lowerfence`, `upperfence`, `notchspan` can be set directly by the users. To have plotly compute them or to show sample points besides the boxes, users can set the `y` data array for vertical boxes (`x` for horizontal boxes) to a 2D array with the outer length corresponding to the number of boxes in the traces and the inner length corresponding the sample size.
VERSION
version 0.042
SYNOPSIS
use Chart::Plotly;
use Chart::Plotly::Trace::Box;
use Chart::Plotly::Plot;
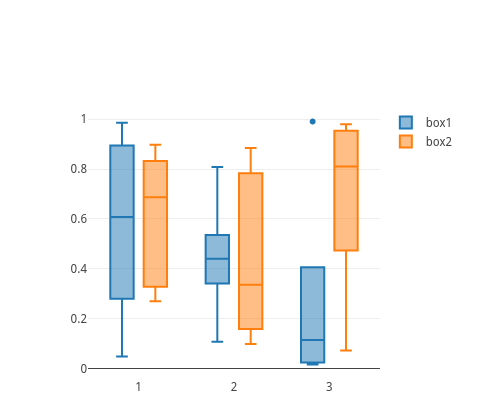
my $x = [ 1, 1, 1, 1, 1, 1, 2, 2, 2, 2, 2, 3, 3, 3, 3, 3 ];
my $box1 = Chart::Plotly::Trace::Box->new( x => $x, y => [ map { rand() } ( 1 .. ( scalar(@$x) ) ) ], name => "box1" );
my $box2 = Chart::Plotly::Trace::Box->new( x => $x, y => [ map { rand() } ( 1 .. ( scalar(@$x) ) ) ], name => "box2" );
my $plot = Chart::Plotly::Plot->new( traces => [ $box1, $box2 ], layout => { boxmode => 'group' } );
Chart::Plotly::show_plot($plot);DESCRIPTION
Each box spans from quartile 1 (Q1) to quartile 3 (Q3). The second quartile (Q2, i.e. the median) is marked by a line inside the box. The fences grow outward from the boxes' edges, by default they span +/- 1.5 times the interquartile range (IQR: Q3-Q1), The sample mean and standard deviation as well as notches and the sample, outlier and suspected outliers points can be optionally added to the box plot. The values and positions corresponding to each boxes can be input using two signatures. The first signature expects users to supply the sample values in the `y` data array for vertical boxes (`x` for horizontal boxes). By supplying an `x` (`y`) array, one box per distinct `x` (`y`) value is drawn If no `x` (`y`) {array} is provided, a single box is drawn. In this case, the box is positioned with the trace `name` or with `x0` (`y0`) if provided. The second signature expects users to supply the boxes corresponding Q1, median and Q3 statistics in the `q1`, `median` and `q3` data arrays respectively. Other box features relying on statistics namely `lowerfence`, `upperfence`, `notchspan` can be set directly by the users. To have plotly compute them or to show sample points besides the boxes, users can set the `y` data array for vertical boxes (`x` for horizontal boxes) to a 2D array with the outer length corresponding to the number of boxes in the traces and the inner length corresponding the sample size.
Screenshot of the above example:
This file has been autogenerated from the official plotly.js source.
If you like Plotly, please support them: https://plot.ly/ Open source announcement: https://plot.ly/javascript/open-source-announcement/
Full reference: https://plot.ly/javascript/reference/#box
DISCLAIMER
This is an unofficial Plotly Perl module. Currently I'm not affiliated in any way with Plotly. But I think plotly.js is a great library and I want to use it with perl.
METHODS
TO_JSON
Serialize the trace to JSON. This method should be called only by JSON serializer.
type
Trace type.
ATTRIBUTES
alignmentgroup
Set several traces linked to the same position axis or matching axes to the same alignmentgroup. This controls whether bars compute their positional range dependently or independently.
boxmean
If *true*, the mean of the box(es)' underlying distribution is drawn as a dashed line inside the box(es). If *sd* the standard deviation is also drawn. Defaults to *true* when `mean` is set. Defaults to *sd* when `sd` is set Otherwise defaults to *false*.
boxpoints
If *outliers*, only the sample points lying outside the whiskers are shown If *suspectedoutliers*, the outlier points are shown and points either less than 4*Q1-3*Q3 or greater than 4*Q3-3*Q1 are highlighted (see `outliercolor`) If *all*, all sample points are shown If *false*, only the box(es) are shown with no sample points Defaults to *suspectedoutliers* when `marker.outliercolor` or `marker.line.outliercolor` is set. Defaults to *all* under the q1/median/q3 signature. Otherwise defaults to *outliers*.
customdata
Assigns extra data each datum. This may be useful when listening to hover, click and selection events. Note that, *scatter* traces also appends customdata items in the markers DOM elements
customdatasrc
Sets the source reference on Chart Studio Cloud for `customdata`.
dx
Sets the x coordinate step for multi-box traces set using q1/median/q3.
dy
Sets the y coordinate step for multi-box traces set using q1/median/q3.
fillcolor
Sets the fill color. Defaults to a half-transparent variant of the line color, marker color, or marker line color, whichever is available.
hoverinfo
Determines which trace information appear on hover. If `none` or `skip` are set, no information is displayed upon hovering. But, if `none` is set, click and hover events are still fired.
hoverinfosrc
Sets the source reference on Chart Studio Cloud for `hoverinfo`.
hoverlabel
hoveron
Do the hover effects highlight individual boxes or sample points or both?
hovertemplate
Template string used for rendering the information that appear on hover box. Note that this will override `hoverinfo`. Variables are inserted using %{variable}, for example "y: %{y}" as well as %{xother}, {%_xother}, {%_xother_}, {%xother_}. When showing info for several points, *xother* will be added to those with different x positions from the first point. An underscore before or after *(x|y)other* will add a space on that side, only when this field is shown. Numbers are formatted using d3-format's syntax %{variable:d3-format}, for example "Price: %{y:$.2f}". https://github.com/d3/d3-format/tree/v1.4.5#d3-format for details on the formatting syntax. Dates are formatted using d3-time-format's syntax %{variable|d3-time-format}, for example "Day: %{2019-01-01|%A}". https://github.com/d3/d3-time-format/tree/v2.2.3#locale_format for details on the date formatting syntax. The variables available in `hovertemplate` are the ones emitted as event data described at this link https://plotly.com/javascript/plotlyjs-events/#event-data. Additionally, every attributes that can be specified per-point (the ones that are `arrayOk: true`) are available. Anything contained in tag `<extra>` is displayed in the secondary box, for example "<extra>{fullData.name}</extra>". To hide the secondary box completely, use an empty tag `<extra></extra>`.
hovertemplatesrc
Sets the source reference on Chart Studio Cloud for `hovertemplate`.
hovertext
Same as `text`.
hovertextsrc
Sets the source reference on Chart Studio Cloud for `hovertext`.
ids
Assigns id labels to each datum. These ids for object constancy of data points during animation. Should be an array of strings, not numbers or any other type.
idssrc
Sets the source reference on Chart Studio Cloud for `ids`.
jitter
Sets the amount of jitter in the sample points drawn. If *0*, the sample points align along the distribution axis. If *1*, the sample points are drawn in a random jitter of width equal to the width of the box(es).
legendgroup
Sets the legend group for this trace. Traces part of the same legend group hide/show at the same time when toggling legend items.
legendgrouptitle
legendrank
Sets the legend rank for this trace. Items and groups with smaller ranks are presented on top/left side while with `*reversed* `legend.traceorder` they are on bottom/right side. The default legendrank is 1000, so that you can use ranks less than 1000 to place certain items before all unranked items, and ranks greater than 1000 to go after all unranked items.
line
lowerfence
Sets the lower fence values. There should be as many items as the number of boxes desired. This attribute has effect only under the q1/median/q3 signature. If `lowerfence` is not provided but a sample (in `y` or `x`) is set, we compute the lower as the last sample point below 1.5 times the IQR.
lowerfencesrc
Sets the source reference on Chart Studio Cloud for `lowerfence`.
marker
mean
Sets the mean values. There should be as many items as the number of boxes desired. This attribute has effect only under the q1/median/q3 signature. If `mean` is not provided but a sample (in `y` or `x`) is set, we compute the mean for each box using the sample values.
meansrc
Sets the source reference on Chart Studio Cloud for `mean`.
median
Sets the median values. There should be as many items as the number of boxes desired.
mediansrc
Sets the source reference on Chart Studio Cloud for `median`.
pmeta
Assigns extra meta information associated with this trace that can be used in various text attributes. Attributes such as trace `name`, graph, axis and colorbar `title.text`, annotation `text` `rangeselector`, `updatemenues` and `sliders` `label` text all support `meta`. To access the trace `meta` values in an attribute in the same trace, simply use `%{meta[i]}` where `i` is the index or key of the `meta` item in question. To access trace `meta` in layout attributes, use `%{data[n[.meta[i]}` where `i` is the index or key of the `meta` and `n` is the trace index.
metasrc
Sets the source reference on Chart Studio Cloud for `meta`.
name
Sets the trace name. The trace name appear as the legend item and on hover. For box traces, the name will also be used for the position coordinate, if `x` and `x0` (`y` and `y0` if horizontal) are missing and the position axis is categorical
notched
Determines whether or not notches are drawn. Notches displays a confidence interval around the median. We compute the confidence interval as median +/- 1.57 * IQR / sqrt(N), where IQR is the interquartile range and N is the sample size. If two boxes' notches do not overlap there is 95% confidence their medians differ. See https://sites.google.com/site/davidsstatistics/home/notched-box-plots for more info. Defaults to *false* unless `notchwidth` or `notchspan` is set.
notchspan
Sets the notch span from the boxes' `median` values. There should be as many items as the number of boxes desired. This attribute has effect only under the q1/median/q3 signature. If `notchspan` is not provided but a sample (in `y` or `x`) is set, we compute it as 1.57 * IQR / sqrt(N), where N is the sample size.
notchspansrc
Sets the source reference on Chart Studio Cloud for `notchspan`.
notchwidth
Sets the width of the notches relative to the box' width. For example, with 0, the notches are as wide as the box(es).
offsetgroup
Set several traces linked to the same position axis or matching axes to the same offsetgroup where bars of the same position coordinate will line up.
opacity
Sets the opacity of the trace.
orientation
Sets the orientation of the box(es). If *v* (*h*), the distribution is visualized along the vertical (horizontal).
pointpos
Sets the position of the sample points in relation to the box(es). If *0*, the sample points are places over the center of the box(es). Positive (negative) values correspond to positions to the right (left) for vertical boxes and above (below) for horizontal boxes
q1
Sets the Quartile 1 values. There should be as many items as the number of boxes desired.
q1src
Sets the source reference on Chart Studio Cloud for `q1`.
q3
Sets the Quartile 3 values. There should be as many items as the number of boxes desired.
q3src
Sets the source reference on Chart Studio Cloud for `q3`.
quartilemethod
Sets the method used to compute the sample's Q1 and Q3 quartiles. The *linear* method uses the 25th percentile for Q1 and 75th percentile for Q3 as computed using method #10 (listed on http://jse.amstat.org/v14n3/langford.html). The *exclusive* method uses the median to divide the ordered dataset into two halves if the sample is odd, it does not include the median in either half - Q1 is then the median of the lower half and Q3 the median of the upper half. The *inclusive* method also uses the median to divide the ordered dataset into two halves but if the sample is odd, it includes the median in both halves - Q1 is then the median of the lower half and Q3 the median of the upper half.
sd
Sets the standard deviation values. There should be as many items as the number of boxes desired. This attribute has effect only under the q1/median/q3 signature. If `sd` is not provided but a sample (in `y` or `x`) is set, we compute the standard deviation for each box using the sample values.
sdsrc
Sets the source reference on Chart Studio Cloud for `sd`.
selected
selectedpoints
Array containing integer indices of selected points. Has an effect only for traces that support selections. Note that an empty array means an empty selection where the `unselected` are turned on for all points, whereas, any other non-array values means no selection all where the `selected` and `unselected` styles have no effect.
showlegend
Determines whether or not an item corresponding to this trace is shown in the legend.
stream
text
Sets the text elements associated with each sample value. If a single string, the same string appears over all the data points. If an array of string, the items are mapped in order to the this trace's (x,y) coordinates. To be seen, trace `hoverinfo` must contain a *text* flag.
textsrc
Sets the source reference on Chart Studio Cloud for `text`.
transforms
uid
Assign an id to this trace, Use this to provide object constancy between traces during animations and transitions.
uirevision
Controls persistence of some user-driven changes to the trace: `constraintrange` in `parcoords` traces, as well as some `editable: true` modifications such as `name` and `colorbar.title`. Defaults to `layout.uirevision`. Note that other user-driven trace attribute changes are controlled by `layout` attributes: `trace.visible` is controlled by `layout.legend.uirevision`, `selectedpoints` is controlled by `layout.selectionrevision`, and `colorbar.(x|y)` (accessible with `config: {editable: true}`) is controlled by `layout.editrevision`. Trace changes are tracked by `uid`, which only falls back on trace index if no `uid` is provided. So if your app can add/remove traces before the end of the `data` array, such that the same trace has a different index, you can still preserve user-driven changes if you give each trace a `uid` that stays with it as it moves.
unselected
upperfence
Sets the upper fence values. There should be as many items as the number of boxes desired. This attribute has effect only under the q1/median/q3 signature. If `upperfence` is not provided but a sample (in `y` or `x`) is set, we compute the lower as the last sample point above 1.5 times the IQR.
upperfencesrc
Sets the source reference on Chart Studio Cloud for `upperfence`.
visible
Determines whether or not this trace is visible. If *legendonly*, the trace is not drawn, but can appear as a legend item (provided that the legend itself is visible).
whiskerwidth
Sets the width of the whiskers relative to the box' width. For example, with 1, the whiskers are as wide as the box(es).
width
Sets the width of the box in data coordinate If *0* (default value) the width is automatically selected based on the positions of other box traces in the same subplot.
x
Sets the x sample data or coordinates. See overview for more info.
x0
Sets the x coordinate for single-box traces or the starting coordinate for multi-box traces set using q1/median/q3. See overview for more info.
xaxis
Sets a reference between this trace's x coordinates and a 2D cartesian x axis. If *x* (the default value), the x coordinates refer to `layout.xaxis`. If *x2*, the x coordinates refer to `layout.xaxis2`, and so on.
xcalendar
Sets the calendar system to use with `x` date data.
xhoverformat
Sets the hover text formatting rulefor `x` using d3 formatting mini-languages which are very similar to those in Python. For numbers, see: https://github.com/d3/d3-format/tree/v1.4.5#d3-format. And for dates see: https://github.com/d3/d3-time-format/tree/v2.2.3#locale_format. We add two items to d3's date formatter: *%h* for half of the year as a decimal number as well as *%{n}f* for fractional seconds with n digits. For example, *2016-10-13 09:15:23.456* with tickformat *%H~%M~%S.%2f* would display *09~15~23.46*By default the values are formatted using `xaxis.hoverformat`.
xperiod
Only relevant when the axis `type` is *date*. Sets the period positioning in milliseconds or *n* on the x axis. Special values in the form of *n* could be used to declare the number of months. In this case `n` must be a positive integer.
xperiod0
Only relevant when the axis `type` is *date*. Sets the base for period positioning in milliseconds or date string on the x0 axis. When `x0period` is round number of weeks, the `x0period0` by default would be on a Sunday i.e. 2000-01-02, otherwise it would be at 2000-01-01.
xperiodalignment
Only relevant when the axis `type` is *date*. Sets the alignment of data points on the x axis.
xsrc
Sets the source reference on Chart Studio Cloud for `x`.
y
Sets the y sample data or coordinates. See overview for more info.
y0
Sets the y coordinate for single-box traces or the starting coordinate for multi-box traces set using q1/median/q3. See overview for more info.
yaxis
Sets a reference between this trace's y coordinates and a 2D cartesian y axis. If *y* (the default value), the y coordinates refer to `layout.yaxis`. If *y2*, the y coordinates refer to `layout.yaxis2`, and so on.
ycalendar
Sets the calendar system to use with `y` date data.
yhoverformat
Sets the hover text formatting rulefor `y` using d3 formatting mini-languages which are very similar to those in Python. For numbers, see: https://github.com/d3/d3-format/tree/v1.4.5#d3-format. And for dates see: https://github.com/d3/d3-time-format/tree/v2.2.3#locale_format. We add two items to d3's date formatter: *%h* for half of the year as a decimal number as well as *%{n}f* for fractional seconds with n digits. For example, *2016-10-13 09:15:23.456* with tickformat *%H~%M~%S.%2f* would display *09~15~23.46*By default the values are formatted using `yaxis.hoverformat`.
yperiod
Only relevant when the axis `type` is *date*. Sets the period positioning in milliseconds or *n* on the y axis. Special values in the form of *n* could be used to declare the number of months. In this case `n` must be a positive integer.
yperiod0
Only relevant when the axis `type` is *date*. Sets the base for period positioning in milliseconds or date string on the y0 axis. When `y0period` is round number of weeks, the `y0period0` by default would be on a Sunday i.e. 2000-01-02, otherwise it would be at 2000-01-01.
yperiodalignment
Only relevant when the axis `type` is *date*. Sets the alignment of data points on the y axis.
ysrc
Sets the source reference on Chart Studio Cloud for `y`.
AUTHOR
Pablo Rodríguez González <pablo.rodriguez.gonzalez@gmail.com>
COPYRIGHT AND LICENSE
This software is Copyright (c) 2022 by Pablo Rodríguez González.
This is free software, licensed under:
The MIT (X11) License