NAME
Chart::Plotly::Trace::Pie - A data visualized by the sectors of the pie is set in `values`. The sector labels are set in `labels`. The sector colors are set in `marker.colors`
VERSION
version 0.042
SYNOPSIS
use HTML::Show;
use Chart::Plotly;
use Chart::Plotly::Trace::Pie;
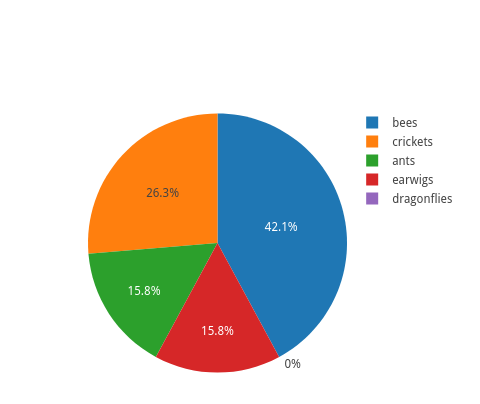
my @labels = ( "ants", "bees", "crickets", "dragonflies", "earwigs" );
my $pie = Chart::Plotly::Trace::Pie->new( labels => \@labels, values => [ map { int( rand() * 10 ) } @labels ] );
HTML::Show::show( Chart::Plotly::render_full_html( data => [$pie] ) );DESCRIPTION
A data visualized by the sectors of the pie is set in `values`. The sector labels are set in `labels`. The sector colors are set in `marker.colors`
Screenshot of the above example:
This file has been autogenerated from the official plotly.js source.
If you like Plotly, please support them: https://plot.ly/ Open source announcement: https://plot.ly/javascript/open-source-announcement/
Full reference: https://plot.ly/javascript/reference/#pie
DISCLAIMER
This is an unofficial Plotly Perl module. Currently I'm not affiliated in any way with Plotly. But I think plotly.js is a great library and I want to use it with perl.
METHODS
TO_JSON
Serialize the trace to JSON. This method should be called only by JSON serializer.
type
Trace type.
ATTRIBUTES
automargin
Determines whether outside text labels can push the margins.
customdata
Assigns extra data each datum. This may be useful when listening to hover, click and selection events. Note that, *scatter* traces also appends customdata items in the markers DOM elements
customdatasrc
Sets the source reference on Chart Studio Cloud for `customdata`.
direction
Specifies the direction at which succeeding sectors follow one another.
dlabel
Sets the label step. See `label0` for more info.
domain
hole
Sets the fraction of the radius to cut out of the pie. Use this to make a donut chart.
hoverinfo
Determines which trace information appear on hover. If `none` or `skip` are set, no information is displayed upon hovering. But, if `none` is set, click and hover events are still fired.
hoverinfosrc
Sets the source reference on Chart Studio Cloud for `hoverinfo`.
hoverlabel
hovertemplate
Template string used for rendering the information that appear on hover box. Note that this will override `hoverinfo`. Variables are inserted using %{variable}, for example "y: %{y}" as well as %{xother}, {%_xother}, {%_xother_}, {%xother_}. When showing info for several points, *xother* will be added to those with different x positions from the first point. An underscore before or after *(x|y)other* will add a space on that side, only when this field is shown. Numbers are formatted using d3-format's syntax %{variable:d3-format}, for example "Price: %{y:$.2f}". https://github.com/d3/d3-format/tree/v1.4.5#d3-format for details on the formatting syntax. Dates are formatted using d3-time-format's syntax %{variable|d3-time-format}, for example "Day: %{2019-01-01|%A}". https://github.com/d3/d3-time-format/tree/v2.2.3#locale_format for details on the date formatting syntax. The variables available in `hovertemplate` are the ones emitted as event data described at this link https://plotly.com/javascript/plotlyjs-events/#event-data. Additionally, every attributes that can be specified per-point (the ones that are `arrayOk: true`) are available. variables `label`, `color`, `value`, `percent` and `text`. Anything contained in tag `<extra>` is displayed in the secondary box, for example "<extra>{fullData.name}</extra>". To hide the secondary box completely, use an empty tag `<extra></extra>`.
hovertemplatesrc
Sets the source reference on Chart Studio Cloud for `hovertemplate`.
hovertext
Sets hover text elements associated with each sector. If a single string, the same string appears for all data points. If an array of string, the items are mapped in order of this trace's sectors. To be seen, trace `hoverinfo` must contain a *text* flag.
hovertextsrc
Sets the source reference on Chart Studio Cloud for `hovertext`.
ids
Assigns id labels to each datum. These ids for object constancy of data points during animation. Should be an array of strings, not numbers or any other type.
idssrc
Sets the source reference on Chart Studio Cloud for `ids`.
insidetextfont
insidetextorientation
Controls the orientation of the text inside chart sectors. When set to *auto*, text may be oriented in any direction in order to be as big as possible in the middle of a sector. The *horizontal* option orients text to be parallel with the bottom of the chart, and may make text smaller in order to achieve that goal. The *radial* option orients text along the radius of the sector. The *tangential* option orients text perpendicular to the radius of the sector.
label0
Alternate to `labels`. Builds a numeric set of labels. Use with `dlabel` where `label0` is the starting label and `dlabel` the step.
labels
Sets the sector labels. If `labels` entries are duplicated, we sum associated `values` or simply count occurrences if `values` is not provided. For other array attributes (including color) we use the first non-empty entry among all occurrences of the label.
labelssrc
Sets the source reference on Chart Studio Cloud for `labels`.
legendgroup
Sets the legend group for this trace. Traces part of the same legend group hide/show at the same time when toggling legend items.
legendgrouptitle
legendrank
Sets the legend rank for this trace. Items and groups with smaller ranks are presented on top/left side while with `*reversed* `legend.traceorder` they are on bottom/right side. The default legendrank is 1000, so that you can use ranks less than 1000 to place certain items before all unranked items, and ranks greater than 1000 to go after all unranked items.
marker
pmeta
Assigns extra meta information associated with this trace that can be used in various text attributes. Attributes such as trace `name`, graph, axis and colorbar `title.text`, annotation `text` `rangeselector`, `updatemenues` and `sliders` `label` text all support `meta`. To access the trace `meta` values in an attribute in the same trace, simply use `%{meta[i]}` where `i` is the index or key of the `meta` item in question. To access trace `meta` in layout attributes, use `%{data[n[.meta[i]}` where `i` is the index or key of the `meta` and `n` is the trace index.
metasrc
Sets the source reference on Chart Studio Cloud for `meta`.
name
Sets the trace name. The trace name appear as the legend item and on hover.
opacity
Sets the opacity of the trace.
outsidetextfont
pull
Sets the fraction of larger radius to pull the sectors out from the center. This can be a constant to pull all slices apart from each other equally or an array to highlight one or more slices.
pullsrc
Sets the source reference on Chart Studio Cloud for `pull`.
rotation
Instead of the first slice starting at 12 o'clock, rotate to some other angle.
scalegroup
If there are multiple pie charts that should be sized according to their totals, link them by providing a non-empty group id here shared by every trace in the same group.
showlegend
Determines whether or not an item corresponding to this trace is shown in the legend.
sort
Determines whether or not the sectors are reordered from largest to smallest.
stream
text
Sets text elements associated with each sector. If trace `textinfo` contains a *text* flag, these elements will be seen on the chart. If trace `hoverinfo` contains a *text* flag and *hovertext* is not set, these elements will be seen in the hover labels.
textfont
textinfo
Determines which trace information appear on the graph.
textposition
Specifies the location of the `textinfo`.
textpositionsrc
Sets the source reference on Chart Studio Cloud for `textposition`.
textsrc
Sets the source reference on Chart Studio Cloud for `text`.
texttemplate
Template string used for rendering the information text that appear on points. Note that this will override `textinfo`. Variables are inserted using %{variable}, for example "y: %{y}". Numbers are formatted using d3-format's syntax %{variable:d3-format}, for example "Price: %{y:$.2f}". https://github.com/d3/d3-format/tree/v1.4.5#d3-format for details on the formatting syntax. Dates are formatted using d3-time-format's syntax %{variable|d3-time-format}, for example "Day: %{2019-01-01|%A}". https://github.com/d3/d3-time-format/tree/v2.2.3#locale_format for details on the date formatting syntax. Every attributes that can be specified per-point (the ones that are `arrayOk: true`) are available. variables `label`, `color`, `value`, `percent` and `text`.
texttemplatesrc
Sets the source reference on Chart Studio Cloud for `texttemplate`.
title
transforms
uid
Assign an id to this trace, Use this to provide object constancy between traces during animations and transitions.
uirevision
Controls persistence of some user-driven changes to the trace: `constraintrange` in `parcoords` traces, as well as some `editable: true` modifications such as `name` and `colorbar.title`. Defaults to `layout.uirevision`. Note that other user-driven trace attribute changes are controlled by `layout` attributes: `trace.visible` is controlled by `layout.legend.uirevision`, `selectedpoints` is controlled by `layout.selectionrevision`, and `colorbar.(x|y)` (accessible with `config: {editable: true}`) is controlled by `layout.editrevision`. Trace changes are tracked by `uid`, which only falls back on trace index if no `uid` is provided. So if your app can add/remove traces before the end of the `data` array, such that the same trace has a different index, you can still preserve user-driven changes if you give each trace a `uid` that stays with it as it moves.
values
Sets the values of the sectors. If omitted, we count occurrences of each label.
valuessrc
Sets the source reference on Chart Studio Cloud for `values`.
visible
Determines whether or not this trace is visible. If *legendonly*, the trace is not drawn, but can appear as a legend item (provided that the legend itself is visible).
AUTHOR
Pablo Rodríguez González <pablo.rodriguez.gonzalez@gmail.com>
COPYRIGHT AND LICENSE
This software is Copyright (c) 2022 by Pablo Rodríguez González.
This is free software, licensed under:
The MIT (X11) License