NAME
Chart::Plotly::Trace::Treemap - Visualize hierarchal data from leaves (and/or outer branches) towards root with rectangles. The treemap sectors are determined by the entries in *labels* or *ids* and in *parents*.
VERSION
version 0.042
SYNOPSIS
use Chart::Plotly;
use Chart::Plotly::Plot;
use JSON;
use Chart::Plotly::Trace::Treemap;

# Example from https://github.com/plotly/plotly.js/blob/3004a9ac8300f8d8681ba2cdfb9833856a6f37fa/test/image/mocks/treemap_with-without_values.json
my $trace1 = Chart::Plotly::Trace::Treemap->new({'name' => 'without values', 'domain' => {'x' => [0.01, 0.33, ], }, 'labels' => ['Alpha', 'Bravo', 'Charlie', 'Delta', 'Echo', 'Foxtrot', 'Golf', 'Hotel', 'India', 'Juliet', 'Kilo', 'Lima', 'Mike', 'November', 'Oscar', 'Papa', 'Quebec', 'Romeo', 'Sierra', 'Tango', 'Uniform', 'Victor', 'Whiskey', 'X ray', 'Yankee', 'Zulu', ], 'parents' => ['', 'Alpha', 'Alpha', 'Charlie', 'Charlie', 'Charlie', 'Foxtrot', 'Foxtrot', 'Foxtrot', 'Foxtrot', 'Juliet', 'Juliet', 'Juliet', 'Juliet', 'Juliet', 'Oscar', 'Oscar', 'Oscar', 'Oscar', 'Oscar', 'Oscar', 'Uniform', 'Uniform', 'Uniform', 'Uniform', 'Uniform', 'Uniform', ], 'hoverinfo' => 'all', 'level' => 'Oscar', 'textinfo' => 'label+value+percent parent+percent entry+percent root+text+current path', });

my $plot = Chart::Plotly::Plot->new(
    traces => [$trace1, ],
    layout =>
        {'width' => 1500, 'height' => 600, 'annotations' => [{'xanchor' => 'center', 'y' => 0, 'x' => 0.17, 'showarrow' => JSON::false, 'text' => '<b>with counted leaves<br>', 'yanchor' => 'top', }, {'showarrow' => JSON::false, 'x' => 0.5, 'yanchor' => 'top', 'text' => '<b>with values and branchvalues: total<br>', 'xanchor' => 'center', 'y' => 0, }, {'y' => 0, 'xanchor' => 'center', 'yanchor' => 'top', 'text' => '<b>with values and branchvalues: remainder<br>', 'showarrow' => JSON::false, 'x' => 0.83, }, ], 'margin' => {'r' => 0, 't' => 50, 'b' => 25, 'l' => 0, }, 'shapes' => [{'x1' => 0.33, 'type' => 'rect', 'x0' => 0.01, 'y0' => 0, 'layer' => 'above', 'y1' => 1, }, {'y0' => 0, 'x0' => 0.34, 'x1' => 0.66, 'type' => 'rect', 'y1' => 1, 'layer' => 'above', }, {'y0' => 0, 'x0' => 0.67, 'x1' => 0.99, 'type' => 'rect', 'y1' => 1, 'layer' => 'above', }, ], }
);

Chart::Plotly::show_plot($plot);
DESCRIPTION
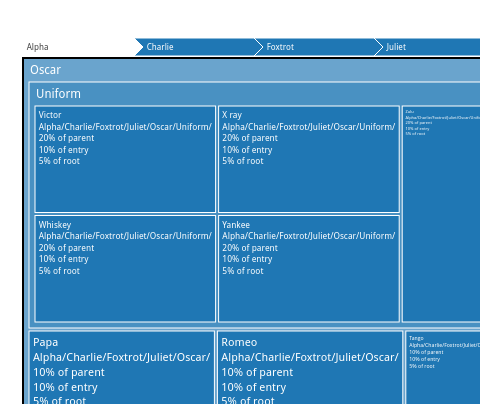
Visualize hierarchal data from leaves (and/or outer branches) towards root with rectangles. The treemap sectors are determined by the entries in *labels* or *ids* and in *parents*.
Screenshot of the above example:
This file has been autogenerated from the official plotly.js source.
If you like Plotly, please support them: https://plot.ly/ Open source announcement: https://plot.ly/javascript/open-source-announcement/
Full reference: https://plot.ly/javascript/reference/#treemap
DISCLAIMER
This is an unofficial Plotly Perl module. Currently I'm not affiliated in any way with Plotly. But I think plotly.js is a great library and I want to use it with perl.
METHODS
TO_JSON
Serialize the trace to JSON. This method should be called only by JSON serializer.
type
Trace type.
ATTRIBUTES
branchvalues
Determines how the items in `values` are summed. When set to *total*, items in `values` are taken to be value of all its descendants. When set to *remainder*, items in `values` corresponding to the root and the branches sectors are taken to be the extra part not part of the sum of the values at their leaves.
count
Determines default for `values` when it is not provided, by inferring a 1 for each of the *leaves* and/or *branches*, otherwise 0.
customdata
Assigns extra data each datum. This may be useful when listening to hover, click and selection events. Note that, *scatter* traces also appends customdata items in the markers DOM elements
customdatasrc
Sets the source reference on Chart Studio Cloud for `customdata`.
domain
hoverinfo
Determines which trace information appear on hover. If `none` or `skip` are set, no information is displayed upon hovering. But, if `none` is set, click and hover events are still fired.
hoverinfosrc
Sets the source reference on Chart Studio Cloud for `hoverinfo`.
hoverlabel
hovertemplate
Template string used for rendering the information that appear on hover box. Note that this will override `hoverinfo`. Variables are inserted using %{variable}, for example "y: %{y}" as well as %{xother}, {%_xother}, {%_xother_}, {%xother_}. When showing info for several points, *xother* will be added to those with different x positions from the first point. An underscore before or after *(x|y)other* will add a space on that side, only when this field is shown. Numbers are formatted using d3-format's syntax %{variable:d3-format}, for example "Price: %{y:$.2f}". https://github.com/d3/d3-format/tree/v1.4.5#d3-format for details on the formatting syntax. Dates are formatted using d3-time-format's syntax %{variable|d3-time-format}, for example "Day: %{2019-01-01|%A}". https://github.com/d3/d3-time-format/tree/v2.2.3#locale_format for details on the date formatting syntax. The variables available in `hovertemplate` are the ones emitted as event data described at this link https://plotly.com/javascript/plotlyjs-events/#event-data. Additionally, every attributes that can be specified per-point (the ones that are `arrayOk: true`) are available. variables `currentPath`, `root`, `entry`, `percentRoot`, `percentEntry` and `percentParent`. Anything contained in tag `<extra>` is displayed in the secondary box, for example "<extra>{fullData.name}</extra>". To hide the secondary box completely, use an empty tag `<extra></extra>`.
hovertemplatesrc
Sets the source reference on Chart Studio Cloud for `hovertemplate`.
hovertext
Sets hover text elements associated with each sector. If a single string, the same string appears for all data points. If an array of string, the items are mapped in order of this trace's sectors. To be seen, trace `hoverinfo` must contain a *text* flag.
hovertextsrc
Sets the source reference on Chart Studio Cloud for `hovertext`.
ids
Assigns id labels to each datum. These ids for object constancy of data points during animation. Should be an array of strings, not numbers or any other type.
idssrc
Sets the source reference on Chart Studio Cloud for `ids`.
insidetextfont
labels
Sets the labels of each of the sectors.
labelssrc
Sets the source reference on Chart Studio Cloud for `labels`.
legendgrouptitle
legendrank
Sets the legend rank for this trace. Items and groups with smaller ranks are presented on top/left side while with `*reversed* `legend.traceorder` they are on bottom/right side. The default legendrank is 1000, so that you can use ranks less than 1000 to place certain items before all unranked items, and ranks greater than 1000 to go after all unranked items.
level
Sets the level from which this trace hierarchy is rendered. Set `level` to `''` to start from the root node in the hierarchy. Must be an "id" if `ids` is filled in, otherwise plotly attempts to find a matching item in `labels`.
marker
maxdepth
Sets the number of rendered sectors from any given `level`. Set `maxdepth` to *-1* to render all the levels in the hierarchy.
pmeta
Assigns extra meta information associated with this trace that can be used in various text attributes. Attributes such as trace `name`, graph, axis and colorbar `title.text`, annotation `text` `rangeselector`, `updatemenues` and `sliders` `label` text all support `meta`. To access the trace `meta` values in an attribute in the same trace, simply use `%{meta[i]}` where `i` is the index or key of the `meta` item in question. To access trace `meta` in layout attributes, use `%{data[n[.meta[i]}` where `i` is the index or key of the `meta` and `n` is the trace index.
metasrc
Sets the source reference on Chart Studio Cloud for `meta`.
name
Sets the trace name. The trace name appear as the legend item and on hover.
opacity
Sets the opacity of the trace.
outsidetextfont
parents
Sets the parent sectors for each of the sectors. Empty string items '' are understood to reference the root node in the hierarchy. If `ids` is filled, `parents` items are understood to be "ids" themselves. When `ids` is not set, plotly attempts to find matching items in `labels`, but beware they must be unique.
parentssrc
Sets the source reference on Chart Studio Cloud for `parents`.
pathbar
root
sort
Determines whether or not the sectors are reordered from largest to smallest.
stream
text
Sets text elements associated with each sector. If trace `textinfo` contains a *text* flag, these elements will be seen on the chart. If trace `hoverinfo` contains a *text* flag and *hovertext* is not set, these elements will be seen in the hover labels.
textfont
textinfo
Determines which trace information appear on the graph.
textposition
Sets the positions of the `text` elements.
textsrc
Sets the source reference on Chart Studio Cloud for `text`.
texttemplate
Template string used for rendering the information text that appear on points. Note that this will override `textinfo`. Variables are inserted using %{variable}, for example "y: %{y}". Numbers are formatted using d3-format's syntax %{variable:d3-format}, for example "Price: %{y:$.2f}". https://github.com/d3/d3-format/tree/v1.4.5#d3-format for details on the formatting syntax. Dates are formatted using d3-time-format's syntax %{variable|d3-time-format}, for example "Day: %{2019-01-01|%A}". https://github.com/d3/d3-time-format/tree/v2.2.3#locale_format for details on the date formatting syntax. Every attributes that can be specified per-point (the ones that are `arrayOk: true`) are available. variables `currentPath`, `root`, `entry`, `percentRoot`, `percentEntry`, `percentParent`, `label` and `value`.
texttemplatesrc
Sets the source reference on Chart Studio Cloud for `texttemplate`.
tiling
transforms
uid
Assign an id to this trace, Use this to provide object constancy between traces during animations and transitions.
uirevision
Controls persistence of some user-driven changes to the trace: `constraintrange` in `parcoords` traces, as well as some `editable: true` modifications such as `name` and `colorbar.title`. Defaults to `layout.uirevision`. Note that other user-driven trace attribute changes are controlled by `layout` attributes: `trace.visible` is controlled by `layout.legend.uirevision`, `selectedpoints` is controlled by `layout.selectionrevision`, and `colorbar.(x|y)` (accessible with `config: {editable: true}`) is controlled by `layout.editrevision`. Trace changes are tracked by `uid`, which only falls back on trace index if no `uid` is provided. So if your app can add/remove traces before the end of the `data` array, such that the same trace has a different index, you can still preserve user-driven changes if you give each trace a `uid` that stays with it as it moves.
values
Sets the values associated with each of the sectors. Use with `branchvalues` to determine how the values are summed.
valuessrc
Sets the source reference on Chart Studio Cloud for `values`.
visible
Determines whether or not this trace is visible. If *legendonly*, the trace is not drawn, but can appear as a legend item (provided that the legend itself is visible).
AUTHOR
Pablo Rodríguez González <pablo.rodriguez.gonzalez@gmail.com>
COPYRIGHT AND LICENSE
This software is Copyright (c) 2022 by Pablo Rodríguez González.
This is free software, licensed under:
The MIT (X11) License