NAME
Term::Fabulous::Widget::Sparkline - A small chart without axes, one row high
SYNOPSIS
use Clay::XS qw(sizing_fixed);
use Term::Fabulous::Widget::Sparkline;

my $load = Term::Fabulous::Widget::Sparkline->new(
	type       => 'line',          # line, area or bar
	values     => \@last_minute,
	min        => 0,
	max        => 100,
	max_points => 60,
	color      => '#61afef',
	layout     => { sizing => { width => sizing_fixed(16) } },
);

$load->add_values($percent);       # every second; the oldest value goes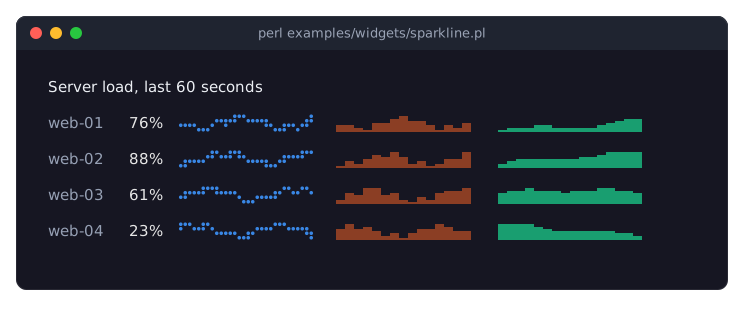
examples/widgets/sparkline.pl shows the three types side by side and adds a value to each every second.
DESCRIPTION
A sparkline is a chart the size of a word: one row high, as wide as the layout gives it, with no axes, labels or legend, for a trend next to a number in a dashboard, a list or a table cell. It holds one series of values and draws it in one of three types:
line-
A line of Braille dots (a quarter of a row high), the values spread over the whole width.
area-
The area under the line, filled with eighth blocks (an eighth of a row high), the values spread over the whole width.
bar-
One column per value, filled with eighth blocks; when there are more values than columns, the newest that fit.
The row covers the range from the smallest to the largest value, so the shape fills the height; min and max fix the range instead, so several sparklines compare (and a bar sparkline grows from min). A line uses the whole range; areas and bars include zero unless zero says otherwise.
A Sparkline is a Term::Fabulous::Widget::XYChart with one series named values, so its options apply: curve, marker, line_style, transform, max_points, span_gaps, and hover, which emphasizes nothing (there is only one series) but fires SeriesHover with the series values and the index and value under the pointer. Unless the layout sets a width or a height, it is one row high and grows in width; a sparkline more rows high draws its shape in all of them. A sparkline has no title unless you give it one (with title, see "CONSTRUCTOR" in Term::Fabulous::Widget::Chart); a title is drawn only when the sparkline is three or more rows high, and takes its first row.
Term::Fabulous::Cookbook::Charts shows sparklines as table cells.
CONSTRUCTOR
new
my $sparkline = Term::Fabulous::Widget::Sparkline->new(%parameters);The parameters of "CONSTRUCTOR" in Term::Fabulous::Widget::Chart (a sparkline never shows a legend, whatever legend says, and shows a title only when it is three or more rows high), the series options of "CONSTRUCTOR" in Term::Fabulous::Widget::XYChart (max_points, curve, marker, ...), and:
type-
line(the default),areaorbar. values-
An array reference of numbers (
undeffor a gap). Default: none. color-
The color of the series, in any format a canvas cell takes. Default:
undef, the first color of thepalette. min,max-
Numbers: the fixed ends of the value range; values beyond them are cut off. With both given,
minmust be less thanmax. Default:undef, from the data. An invalid value, or aminnot below themax, dies when it is given, with a message that namesminormax. zero-
A boolean: whether the range includes 0. Default:
undef, which means true forareaandbar(they grow from 0) and false forline. Withzero => 0, an area or bar sparkline of values far from 0 (prices) spends the row on their changes, and its bars grow from the smallest value.
METHODS
values
my $values = $sparkline->values;
$sparkline->values( [ 1, 2, 3 ] );
Reads (a copy) or replaces the values.
add_values
$sparkline->add_values( 4, 5 );Appends values; with max_points, the oldest are dropped.
type, color, min, max, zero
Read and set the parameters; an invalid value dies and changes nothing.
$sparkline->type('bar');
$sparkline->max(undef);    # from the data again
Everything else: "METHODS" in Term::Fabulous::Widget::XYChart.
KDL PROPERTIES
use Term::Fabulous::Widget::Sparkline as Sparkline

Sparkline "load" {
	type "bar"
	color "#61afef"
	min 0
	max 100
	max_points 60
	values 12 15 11 18 16
}type, color, min, max, zero as the parameters, values with the numbers as its arguments, and the properties of "KDL PROPERTIES" in Term::Fabulous::Widget::XYChart.
SEE ALSO
Term::Fabulous::Widget::XYChart, Term::Fabulous::Widget::LineChart, Term::Fabulous::Widget::Chart, "CHARTS" in Term::Fabulous::Manual::Charts, "CELL WIDGETS" in Term::Fabulous::Manual::Tables, "Show sparklines in table cells (Sparkline)" in Term::Fabulous::Cookbook::Charts, "Print charts in a report (Static)" in Term::Fabulous::Cookbook::ChartTechniques, the example program examples/widgets/sparkline.pl.