NAME
Chart::Plotly::Trace::Contourcarpet - Plots contours on either the first carpet axis or the carpet axis with a matching `carpet` attribute. Data `z` is interpreted as matching that of the corresponding carpet axis.
VERSION
version 0.018
SYNOPSIS
use Chart::Plotly qw(show_plot);
use Chart::Plotly::Trace::Carpet;
use Chart::Plotly::Trace::Contourcarpet;
# Example data from: https://plot.ly/javascript/carpet-contour/#add-contours
my $contourcarpet = Chart::Plotly::Trace::Contourcarpet->new(
a => [ 0, 1, 2, 3, 0, 1, 2, 3, 0, 1, 2, 3 ],
b => [ 4, 4, 4, 4, 5, 5, 5, 5, 6, 6, 6, 6 ],
z => [ 1, 1.96, 2.56, 3.0625, 4, 5.0625, 1, 7.5625, 9, 12.25, 15.21, 14.0625 ],
autocontour => 0,
contours => {
start => 1,
end => 14,
size => 1
},
line => {
width => 2,
smoothing => 0
},
colorbar => {
len => 0.4,
y => 0.25
}
);
my $carpet = Chart::Plotly::Trace::Carpet->new(
a => [ 0, 1, 2, 3, 0, 1, 2, 3, 0, 1, 2, 3 ],
b => [ 4, 4, 4, 4, 5, 5, 5, 5, 6, 6, 6, 6 ],
x => [ 2, 3, 4, 5, 2.2, 3.1, 4.1, 5.1, 1.5, 2.5, 3.5, 4.5 ],
y => [ 1, 1.4, 1.6, 1.75, 2, 2.5, 2.7, 2.75, 3, 3.5, 3.7, 3.75 ],
aaxis => {
tickprefix => "a = ",
smoothing => 0,
minorgridcount => 9,
type => 'linear'
},
baxis => {
tickprefix => "b = ",
smoothing => 0,
minorgridcount => 9,
type => 'linear'
}
);
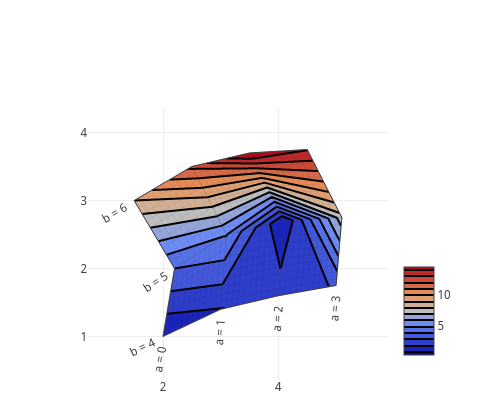
show_plot([ $contourcarpet, $carpet ]);DESCRIPTION
Plots contours on either the first carpet axis or the carpet axis with a matching `carpet` attribute. Data `z` is interpreted as matching that of the corresponding carpet axis.
Screenshot of the above example:
This file has been autogenerated from the official plotly.js source.
If you like Plotly, please support them: https://plot.ly/ Open source announcement: https://plot.ly/javascript/open-source-announcement/
Full reference: https://plot.ly/javascript/reference/#contourcarpet
DISCLAIMER
This is an unofficial Plotly Perl module. Currently I'm not affiliated in any way with Plotly. But I think plotly.js is a great library and I want to use it with perl.
METHODS
TO_JSON
Serialize the trace to JSON. This method should be called only by JSON serializer.
type
Trace type.
ATTRIBUTES
a
Sets the x coordinates.
a0
Alternate to `x`. Builds a linear space of x coordinates. Use with `dx` where `x0` is the starting coordinate and `dx` the step.
asrc
Sets the source reference on plot.ly for a .
atype
If *array*, the heatmap's x coordinates are given by *x* (the default behavior when `x` is provided). If *scaled*, the heatmap's x coordinates are given by *x0* and *dx* (the default behavior when `x` is not provided).
autocolorscale
Determines whether or not the colorscale is picked using the sign of the input z values.
autocontour
Determines whether or not the contour level attributes are picked by an algorithm. If *true*, the number of contour levels can be set in `ncontours`. If *false*, set the contour level attributes in `contours`.
b
Sets the y coordinates.
b0
Alternate to `y`. Builds a linear space of y coordinates. Use with `dy` where `y0` is the starting coordinate and `dy` the step.
bsrc
Sets the source reference on plot.ly for b .
btype
If *array*, the heatmap's y coordinates are given by *y* (the default behavior when `y` is provided) If *scaled*, the heatmap's y coordinates are given by *y0* and *dy* (the default behavior when `y` is not provided)
carpet
The `carpet` of the carpet axes on which this contour trace lies
colorbar
colorscale
Sets the colorscale. The colorscale must be an array containing arrays mapping a normalized value to an rgb, rgba, hex, hsl, hsv, or named color string. At minimum, a mapping for the lowest (0) and highest (1) values are required. For example, `[[0, 'rgb(0,0,255)', [1, 'rgb(255,0,0)']]`. To control the bounds of the colorscale in z space, use zmin and zmax
contours
customdata
Assigns extra data each datum. This may be useful when listening to hover, click and selection events. Note that, *scatter* traces also appends customdata items in the markers DOM elements
customdatasrc
Sets the source reference on plot.ly for customdata .
da
Sets the x coordinate step. See `x0` for more info.
db
Sets the y coordinate step. See `y0` for more info.
fillcolor
Sets the fill color if `contours.type` is *constraint*. Defaults to a half-transparent variant of the line color, marker color, or marker line color, whichever is available.
hoverinfo
Determines which trace information appear on hover. If `none` or `skip` are set, no information is displayed upon hovering. But, if `none` is set, click and hover events are still fired.
hoverinfosrc
Sets the source reference on plot.ly for hoverinfo .
hoverlabel
ids
Assigns id labels to each datum. These ids for object constancy of data points during animation. Should be an array of strings, not numbers or any other type.
idssrc
Sets the source reference on plot.ly for ids .
legendgroup
Sets the legend group for this trace. Traces part of the same legend group hide/show at the same time when toggling legend items.
line
name
Sets the trace name. The trace name appear as the legend item and on hover.
ncontours
Sets the maximum number of contour levels. The actual number of contours will be chosen automatically to be less than or equal to the value of `ncontours`. Has an effect only if `autocontour` is *true* or if `contours.size` is missing.
opacity
Sets the opacity of the trace.
reversescale
Reverses the colorscale.
selectedpoints
Array containing integer indices of selected points. Has an effect only for traces that support selections. Note that an empty array means an empty selection where the `unselected` are turned on for all points, whereas, any other non-array values means no selection all where the `selected` and `unselected` styles have no effect.
showlegend
Determines whether or not an item corresponding to this trace is shown in the legend.
showscale
Determines whether or not a colorbar is displayed for this trace.
stream
text
Sets the text elements associated with each z value.
textsrc
Sets the source reference on plot.ly for text .
transpose
Transposes the z data.
uid
visible
Determines whether or not this trace is visible. If *legendonly*, the trace is not drawn, but can appear as a legend item (provided that the legend itself is visible).
xaxis
Sets a reference between this trace's x coordinates and a 2D cartesian x axis. If *x* (the default value), the x coordinates refer to `layout.xaxis`. If *x2*, the x coordinates refer to `layout.xaxis2`, and so on.
yaxis
Sets a reference between this trace's y coordinates and a 2D cartesian y axis. If *y* (the default value), the y coordinates refer to `layout.yaxis`. If *y2*, the y coordinates refer to `layout.xaxis2`, and so on.
z
Sets the z data.
zauto
Determines the whether or not the color domain is computed with respect to the input data.
zmax
Sets the upper bound of color domain.
zmin
Sets the lower bound of color domain.
zsrc
Sets the source reference on plot.ly for z .
AUTHOR
Pablo Rodríguez González <pablo.rodriguez.gonzalez@gmail.com>
COPYRIGHT AND LICENSE
This software is Copyright (c) 2018 by Pablo Rodríguez González.
This is free software, licensed under:
The MIT (X11) License