NAME
Chart::Plotly::Trace::Streamtube - Use a streamtube trace to visualize flow in a vector field. Specify a vector field using 6 1D arrays of equal length, 3 position arrays `x`, `y` and `z` and 3 vector component arrays `u`, `v`, and `w`. By default, the tubes' starting positions will be cut from the vector field's x-z plane at its minimum y value. To specify your own starting position, use attributes `starts.x`, `starts.y` and `starts.z`.
VERSION
version 0.023
SYNOPSIS
 use Chart::Plotly;
 use Chart::Plotly::Trace::Streamtube;
 use Chart::Plotly::Plot;

 # Example from https://github.com/plotly/plotly.js/blob/273292dcb24170f775dbc7ebb285c9b6a80b10f4/test/image/mocks/gl3d_streamtube-simple.json

 my $trace = Chart::Plotly::Trace::Streamtube->new(
     cmax    => 3,
     cmin    => 0,
     sizeref => 0.5,
     type    => 'streamtube',
     u       => [ (1) x 9, (1.8414709848079) x 9, (1.90929742682568) x 9 ],
     v       => [
            (1) x 3,
            (0.54030230586814) x 3,
            (-0.416146836547142) x 3,
            (1) x 3,
            (0.54030230586814) x 3,
            (-0.416146836547142) x 3,
            (1) x 3,
            (0.54030230586814) x 3,
            (-0.416146836547142) x 3
     ],
     w => [ 0,                  0.0886560619984019, 0.169392742018511,  0,
            0.0886560619984019, 0.169392742018511,  0,                  0.0886560619984019,
            0.169392742018511,  0,                  0.0886560619984019, 0.169392742018511,
            0,                  0.0886560619984019, 0.169392742018511,  0,
            0.0886560619984019, 0.169392742018511,  0,                  0.0886560619984019,
            0.169392742018511,  0,                  0.0886560619984019, 0.169392742018511,
            0,                  0.0886560619984019, 0.169392742018511
     ],
     x => [ (0) x 9, (1) x 9, (2) x 9 ],
     y => [ (0) x 3, (1) x 3, (2) x 3, (0) x 3, (1) x 3, (2) x 3, (0) x 3, (1) x 3, (2) x 3 ],
     z => [ 0, 1, 2, 0, 1, 2, 0, 1, 2, 0, 1, 2, 0, 1, 2, 0, 1, 2, 0, 1, 2, 0, 1, 2, 0, 1, 2 ]

 );

 my $plot = Chart::Plotly::Plot->new( traces => [$trace],
                                      layout => {
                                                  scene => {
                                                             camera => {
                                                                         eye => { x => -0.724361245886518,
                                                                                  y => 1.9269804254718,
                                                                                  z => 0.670482829986172
                                                                         }
                                                             }
                                                  }
                                      }
 );

 Chart::Plotly::show_plot($plot);
DESCRIPTION
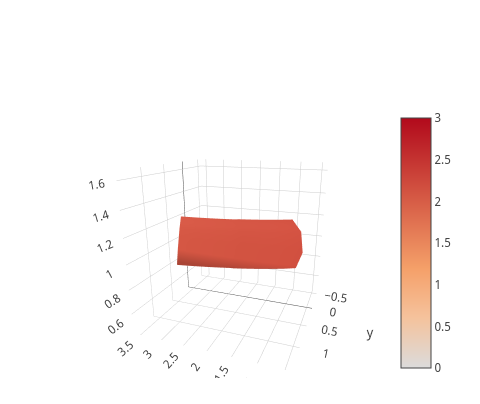
Use a streamtube trace to visualize flow in a vector field. Specify a vector field using 6 1D arrays of equal length, 3 position arrays `x`, `y` and `z` and 3 vector component arrays `u`, `v`, and `w`. By default, the tubes' starting positions will be cut from the vector field's x-z plane at its minimum y value. To specify your own starting position, use attributes `starts.x`, `starts.y` and `starts.z`.
Screenshot of the above example:
This file has been autogenerated from the official plotly.js source.
If you like Plotly, please support them: https://plot.ly/ Open source announcement: https://plot.ly/javascript/open-source-announcement/
Full reference: https://plot.ly/javascript/reference/#streamtube
DISCLAIMER
This is an unofficial Plotly Perl module. Currently I'm not affiliated in any way with Plotly. But I think plotly.js is a great library and I want to use it with perl.
METHODS
TO_JSON
Serialize the trace to JSON. This method should be called only by JSON serializer.
type
Trace type.
ATTRIBUTES
autocolorscale
Determines whether the colorscale is a default palette (`autocolorscale: true`) or the palette determined by `colorscale`. In case `colorscale` is unspecified or `autocolorscale` is true, the default palette will be chosen according to whether numbers in the `color` array are all positive, all negative or mixed.
cauto
Determines whether or not the color domain is computed with respect to the input data (here u/v/w norm) or the bounds set in `cmin` and `cmax` Defaults to `false` when `cmin` and `cmax` are set by the user.
cmax
Sets the upper bound of the color domain. Value should have the same units as u/v/w norm and if set, `cmin` must be set as well.
cmin
Sets the lower bound of the color domain. Value should have the same units as u/v/w norm and if set, `cmax` must be set as well.
colorbar
colorscale
Sets the colorscale. The colorscale must be an array containing arrays mapping a normalized value to an rgb, rgba, hex, hsl, hsv, or named color string. At minimum, a mapping for the lowest (0) and highest (1) values are required. For example, `[[0, 'rgb(0,0,255)', [1, 'rgb(255,0,0)']]`. To control the bounds of the colorscale in color space, use`cmin` and `cmax`. Alternatively, `colorscale` may be a palette name string of the following list: Greys,YlGnBu,Greens,YlOrRd,Bluered,RdBu,Reds,Blues,Picnic,Rainbow,Portland,Jet,Hot,Blackbody,Earth,Electric,Viridis,Cividis.
customdata
Assigns extra data each datum. This may be useful when listening to hover, click and selection events. Note that, *scatter* traces also appends customdata items in the markers DOM elements
customdatasrc
Sets the source reference on plot.ly for customdata .
hoverinfo
Determines which trace information appear on hover. If `none` or `skip` are set, no information is displayed upon hovering. But, if `none` is set, click and hover events are still fired.
hoverinfosrc
Sets the source reference on plot.ly for hoverinfo .
hoverlabel
ids
Assigns id labels to each datum. These ids for object constancy of data points during animation. Should be an array of strings, not numbers or any other type.
idssrc
Sets the source reference on plot.ly for ids .
legendgroup
Sets the legend group for this trace. Traces part of the same legend group hide/show at the same time when toggling legend items.
lighting
lightposition
maxdisplayed
The maximum number of displayed segments in a streamtube.
name
Sets the trace name. The trace name appear as the legend item and on hover.
opacity
Sets the opacity of the surface.
reversescale
Reverses the color mapping if true. If true, `cmin` will correspond to the last color in the array and `cmax` will correspond to the first color.
scene
Sets a reference between this trace's 3D coordinate system and a 3D scene. If *scene* (the default value), the (x,y,z) coordinates refer to `layout.scene`. If *scene2*, the (x,y,z) coordinates refer to `layout.scene2`, and so on.
selectedpoints
Array containing integer indices of selected points. Has an effect only for traces that support selections. Note that an empty array means an empty selection where the `unselected` are turned on for all points, whereas, any other non-array values means no selection all where the `selected` and `unselected` styles have no effect.
showlegend
Determines whether or not an item corresponding to this trace is shown in the legend.
showscale
Determines whether or not a colorbar is displayed for this trace.
sizeref
The scaling factor for the streamtubes. The default is 1, which avoids two max divergence tubes from touching at adjacent starting positions.
starts
stream
text
Sets a text element associated with this trace. If trace `hoverinfo` contains a *text* flag, this text element will be seen in all hover labels. Note that streamtube traces do not support array `text` values.
u
Sets the x components of the vector field.
uid
uirevision
Controls persistence of some user-driven changes to the trace: `constraintrange` in `parcoords` traces, as well as some `editable: true` modifications such as `name` and `colorbar.title`. Defaults to `layout.uirevision`. Note that other user-driven trace attribute changes are controlled by `layout` attributes: `trace.visible` is controlled by `layout.legend.uirevision`, `selectedpoints` is controlled by `layout.selectionrevision`, and `colorbar.(x|y)` (accessible with `config: {editable: true}`) is controlled by `layout.editrevision`. Trace changes are tracked by `uid`, which only falls back on trace index if no `uid` is provided. So if your app can add/remove traces before the end of the `data` array, such that the same trace has a different index, you can still preserve user-driven changes if you give each trace a `uid` that stays with it as it moves.
usrc
Sets the source reference on plot.ly for u .
v
Sets the y components of the vector field.
visible
Determines whether or not this trace is visible. If *legendonly*, the trace is not drawn, but can appear as a legend item (provided that the legend itself is visible).
vsrc
Sets the source reference on plot.ly for v .
w
Sets the z components of the vector field.
wsrc
Sets the source reference on plot.ly for w .
x
Sets the x coordinates of the vector field.
xsrc
Sets the source reference on plot.ly for x .
y
Sets the y coordinates of the vector field.
ysrc
Sets the source reference on plot.ly for y .
z
Sets the z coordinates of the vector field.
zsrc
Sets the source reference on plot.ly for z .
AUTHOR
Pablo Rodríguez González <pablo.rodriguez.gonzalez@gmail.com>
COPYRIGHT AND LICENSE
This software is Copyright (c) 2018 by Pablo Rodríguez González.
This is free software, licensed under:
The MIT (X11) License