NAME
Chart::Plotly::Trace::Heatmap - The data that describes the heatmap value-to-color mapping is set in `z`. Data in `z` can either be a {2D array} of values (ragged or not) or a 1D array of values. In the case where `z` is a {2D array}, say that `z` has N rows and M columns. Then, by default, the resulting heatmap will have N partitions along the y axis and M partitions along the x axis. In other words, the i-th row/ j-th column cell in `z` is mapped to the i-th partition of the y axis (starting from the bottom of the plot) and the j-th partition of the x-axis (starting from the left of the plot). This behavior can be flipped by using `transpose`. Moreover, `x` (`y`) can be provided with M or M+1 (N or N+1) elements. If M (N), then the coordinates correspond to the center of the heatmap cells and the cells have equal width. If M+1 (N+1), then the coordinates correspond to the edges of the heatmap cells. In the case where `z` is a 1D {array}, the x and y coordinates must be provided in `x` and `y` respectively to form data triplets.
VERSION
version 0.042
SYNOPSIS
use Chart::Plotly qw(show_plot);
use Chart::Plotly::Trace::Heatmap;
use English qw(-no_match_vars);
my $heatmap = Chart::Plotly::Trace::Heatmap->new(
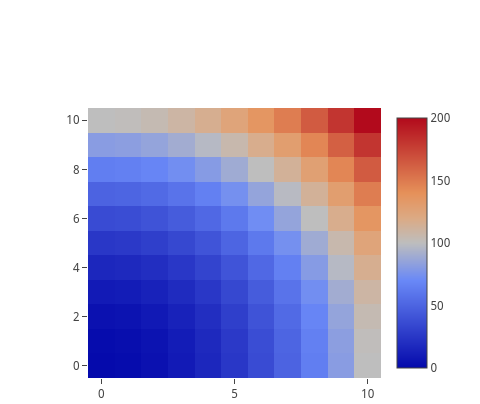
x => [ 0 .. 10 ],
y => [ 0 .. 10 ],
z => [
map {
my $y = $ARG;
[ map { $ARG * $ARG + $y * $y } ( 0 .. 10 ) ]
} ( 0 .. 10 )
]
);
show_plot( [$heatmap] );DESCRIPTION
The data that describes the heatmap value-to-color mapping is set in `z`. Data in `z` can either be a {2D array} of values (ragged or not) or a 1D array of values. In the case where `z` is a {2D array}, say that `z` has N rows and M columns. Then, by default, the resulting heatmap will have N partitions along the y axis and M partitions along the x axis. In other words, the i-th row/ j-th column cell in `z` is mapped to the i-th partition of the y axis (starting from the bottom of the plot) and the j-th partition of the x-axis (starting from the left of the plot). This behavior can be flipped by using `transpose`. Moreover, `x` (`y`) can be provided with M or M+1 (N or N+1) elements. If M (N), then the coordinates correspond to the center of the heatmap cells and the cells have equal width. If M+1 (N+1), then the coordinates correspond to the edges of the heatmap cells. In the case where `z` is a 1D {array}, the x and y coordinates must be provided in `x` and `y` respectively to form data triplets.
Screenshot of the above example:
This file has been autogenerated from the official plotly.js source.
If you like Plotly, please support them: https://plot.ly/ Open source announcement: https://plot.ly/javascript/open-source-announcement/
Full reference: https://plot.ly/javascript/reference/#heatmap
DISCLAIMER
This is an unofficial Plotly Perl module. Currently I'm not affiliated in any way with Plotly. But I think plotly.js is a great library and I want to use it with perl.
METHODS
TO_JSON
Serialize the trace to JSON. This method should be called only by JSON serializer.
type
Trace type.
ATTRIBUTES
autocolorscale
Determines whether the colorscale is a default palette (`autocolorscale: true`) or the palette determined by `colorscale`. In case `colorscale` is unspecified or `autocolorscale` is true, the default palette will be chosen according to whether numbers in the `color` array are all positive, all negative or mixed.
coloraxis
Sets a reference to a shared color axis. References to these shared color axes are *coloraxis*, *coloraxis2*, *coloraxis3*, etc. Settings for these shared color axes are set in the layout, under `layout.coloraxis`, `layout.coloraxis2`, etc. Note that multiple color scales can be linked to the same color axis.
colorbar
colorscale
Sets the colorscale. The colorscale must be an array containing arrays mapping a normalized value to an rgb, rgba, hex, hsl, hsv, or named color string. At minimum, a mapping for the lowest (0) and highest (1) values are required. For example, `[[0, 'rgb(0,0,255)'], [1, 'rgb(255,0,0)']]`. To control the bounds of the colorscale in color space, use `zmin` and `zmax`. Alternatively, `colorscale` may be a palette name string of the following list: Blackbody,Bluered,Blues,Cividis,Earth,Electric,Greens,Greys,Hot,Jet,Picnic,Portland,Rainbow,RdBu,Reds,Viridis,YlGnBu,YlOrRd.
connectgaps
Determines whether or not gaps (i.e. {nan} or missing values) in the `z` data are filled in. It is defaulted to true if `z` is a one dimensional array and `zsmooth` is not false; otherwise it is defaulted to false.
customdata
Assigns extra data each datum. This may be useful when listening to hover, click and selection events. Note that, *scatter* traces also appends customdata items in the markers DOM elements
customdatasrc
Sets the source reference on Chart Studio Cloud for `customdata`.
dx
Sets the x coordinate step. See `x0` for more info.
dy
Sets the y coordinate step. See `y0` for more info.
hoverinfo
Determines which trace information appear on hover. If `none` or `skip` are set, no information is displayed upon hovering. But, if `none` is set, click and hover events are still fired.
hoverinfosrc
Sets the source reference on Chart Studio Cloud for `hoverinfo`.
hoverlabel
hoverongaps
Determines whether or not gaps (i.e. {nan} or missing values) in the `z` data have hover labels associated with them.
hovertemplate
Template string used for rendering the information that appear on hover box. Note that this will override `hoverinfo`. Variables are inserted using %{variable}, for example "y: %{y}" as well as %{xother}, {%_xother}, {%_xother_}, {%xother_}. When showing info for several points, *xother* will be added to those with different x positions from the first point. An underscore before or after *(x|y)other* will add a space on that side, only when this field is shown. Numbers are formatted using d3-format's syntax %{variable:d3-format}, for example "Price: %{y:$.2f}". https://github.com/d3/d3-format/tree/v1.4.5#d3-format for details on the formatting syntax. Dates are formatted using d3-time-format's syntax %{variable|d3-time-format}, for example "Day: %{2019-01-01|%A}". https://github.com/d3/d3-time-format/tree/v2.2.3#locale_format for details on the date formatting syntax. The variables available in `hovertemplate` are the ones emitted as event data described at this link https://plotly.com/javascript/plotlyjs-events/#event-data. Additionally, every attributes that can be specified per-point (the ones that are `arrayOk: true`) are available. Anything contained in tag `<extra>` is displayed in the secondary box, for example "<extra>{fullData.name}</extra>". To hide the secondary box completely, use an empty tag `<extra></extra>`.
hovertemplatesrc
Sets the source reference on Chart Studio Cloud for `hovertemplate`.
hovertext
Same as `text`.
hovertextsrc
Sets the source reference on Chart Studio Cloud for `hovertext`.
ids
Assigns id labels to each datum. These ids for object constancy of data points during animation. Should be an array of strings, not numbers or any other type.
idssrc
Sets the source reference on Chart Studio Cloud for `ids`.
legendgroup
Sets the legend group for this trace. Traces part of the same legend group hide/show at the same time when toggling legend items.
legendgrouptitle
legendrank
Sets the legend rank for this trace. Items and groups with smaller ranks are presented on top/left side while with `*reversed* `legend.traceorder` they are on bottom/right side. The default legendrank is 1000, so that you can use ranks less than 1000 to place certain items before all unranked items, and ranks greater than 1000 to go after all unranked items.
pmeta
Assigns extra meta information associated with this trace that can be used in various text attributes. Attributes such as trace `name`, graph, axis and colorbar `title.text`, annotation `text` `rangeselector`, `updatemenues` and `sliders` `label` text all support `meta`. To access the trace `meta` values in an attribute in the same trace, simply use `%{meta[i]}` where `i` is the index or key of the `meta` item in question. To access trace `meta` in layout attributes, use `%{data[n[.meta[i]}` where `i` is the index or key of the `meta` and `n` is the trace index.
metasrc
Sets the source reference on Chart Studio Cloud for `meta`.
name
Sets the trace name. The trace name appear as the legend item and on hover.
opacity
Sets the opacity of the trace.
reversescale
Reverses the color mapping if true. If true, `zmin` will correspond to the last color in the array and `zmax` will correspond to the first color.
showlegend
Determines whether or not an item corresponding to this trace is shown in the legend.
showscale
Determines whether or not a colorbar is displayed for this trace.
stream
text
Sets the text elements associated with each z value.
textfont
textsrc
Sets the source reference on Chart Studio Cloud for `text`.
texttemplate
Template string used for rendering the information text that appear on points. Note that this will override `textinfo`. Variables are inserted using %{variable}, for example "y: %{y}". Numbers are formatted using d3-format's syntax %{variable:d3-format}, for example "Price: %{y:$.2f}". https://github.com/d3/d3-format/tree/v1.4.5#d3-format for details on the formatting syntax. Dates are formatted using d3-time-format's syntax %{variable|d3-time-format}, for example "Day: %{2019-01-01|%A}". https://github.com/d3/d3-time-format/tree/v2.2.3#locale_format for details on the date formatting syntax. Every attributes that can be specified per-point (the ones that are `arrayOk: true`) are available. variables `x`, `y`, `z` and `text`.
transforms
transpose
Transposes the z data.
uid
Assign an id to this trace, Use this to provide object constancy between traces during animations and transitions.
uirevision
Controls persistence of some user-driven changes to the trace: `constraintrange` in `parcoords` traces, as well as some `editable: true` modifications such as `name` and `colorbar.title`. Defaults to `layout.uirevision`. Note that other user-driven trace attribute changes are controlled by `layout` attributes: `trace.visible` is controlled by `layout.legend.uirevision`, `selectedpoints` is controlled by `layout.selectionrevision`, and `colorbar.(x|y)` (accessible with `config: {editable: true}`) is controlled by `layout.editrevision`. Trace changes are tracked by `uid`, which only falls back on trace index if no `uid` is provided. So if your app can add/remove traces before the end of the `data` array, such that the same trace has a different index, you can still preserve user-driven changes if you give each trace a `uid` that stays with it as it moves.
visible
Determines whether or not this trace is visible. If *legendonly*, the trace is not drawn, but can appear as a legend item (provided that the legend itself is visible).
x
Sets the x coordinates.
x0
Alternate to `x`. Builds a linear space of x coordinates. Use with `dx` where `x0` is the starting coordinate and `dx` the step.
xaxis
Sets a reference between this trace's x coordinates and a 2D cartesian x axis. If *x* (the default value), the x coordinates refer to `layout.xaxis`. If *x2*, the x coordinates refer to `layout.xaxis2`, and so on.
xcalendar
Sets the calendar system to use with `x` date data.
xgap
Sets the horizontal gap (in pixels) between bricks.
xhoverformat
Sets the hover text formatting rulefor `x` using d3 formatting mini-languages which are very similar to those in Python. For numbers, see: https://github.com/d3/d3-format/tree/v1.4.5#d3-format. And for dates see: https://github.com/d3/d3-time-format/tree/v2.2.3#locale_format. We add two items to d3's date formatter: *%h* for half of the year as a decimal number as well as *%{n}f* for fractional seconds with n digits. For example, *2016-10-13 09:15:23.456* with tickformat *%H~%M~%S.%2f* would display *09~15~23.46*By default the values are formatted using `xaxis.hoverformat`.
xperiod
Only relevant when the axis `type` is *date*. Sets the period positioning in milliseconds or *n* on the x axis. Special values in the form of *n* could be used to declare the number of months. In this case `n` must be a positive integer.
xperiod0
Only relevant when the axis `type` is *date*. Sets the base for period positioning in milliseconds or date string on the x0 axis. When `x0period` is round number of weeks, the `x0period0` by default would be on a Sunday i.e. 2000-01-02, otherwise it would be at 2000-01-01.
xperiodalignment
Only relevant when the axis `type` is *date*. Sets the alignment of data points on the x axis.
xsrc
Sets the source reference on Chart Studio Cloud for `x`.
xtype
If *array*, the heatmap's x coordinates are given by *x* (the default behavior when `x` is provided). If *scaled*, the heatmap's x coordinates are given by *x0* and *dx* (the default behavior when `x` is not provided).
y
Sets the y coordinates.
y0
Alternate to `y`. Builds a linear space of y coordinates. Use with `dy` where `y0` is the starting coordinate and `dy` the step.
yaxis
Sets a reference between this trace's y coordinates and a 2D cartesian y axis. If *y* (the default value), the y coordinates refer to `layout.yaxis`. If *y2*, the y coordinates refer to `layout.yaxis2`, and so on.
ycalendar
Sets the calendar system to use with `y` date data.
ygap
Sets the vertical gap (in pixels) between bricks.
yhoverformat
Sets the hover text formatting rulefor `y` using d3 formatting mini-languages which are very similar to those in Python. For numbers, see: https://github.com/d3/d3-format/tree/v1.4.5#d3-format. And for dates see: https://github.com/d3/d3-time-format/tree/v2.2.3#locale_format. We add two items to d3's date formatter: *%h* for half of the year as a decimal number as well as *%{n}f* for fractional seconds with n digits. For example, *2016-10-13 09:15:23.456* with tickformat *%H~%M~%S.%2f* would display *09~15~23.46*By default the values are formatted using `yaxis.hoverformat`.
yperiod
Only relevant when the axis `type` is *date*. Sets the period positioning in milliseconds or *n* on the y axis. Special values in the form of *n* could be used to declare the number of months. In this case `n` must be a positive integer.
yperiod0
Only relevant when the axis `type` is *date*. Sets the base for period positioning in milliseconds or date string on the y0 axis. When `y0period` is round number of weeks, the `y0period0` by default would be on a Sunday i.e. 2000-01-02, otherwise it would be at 2000-01-01.
yperiodalignment
Only relevant when the axis `type` is *date*. Sets the alignment of data points on the y axis.
ysrc
Sets the source reference on Chart Studio Cloud for `y`.
ytype
If *array*, the heatmap's y coordinates are given by *y* (the default behavior when `y` is provided) If *scaled*, the heatmap's y coordinates are given by *y0* and *dy* (the default behavior when `y` is not provided)
z
Sets the z data.
zauto
Determines whether or not the color domain is computed with respect to the input data (here in `z`) or the bounds set in `zmin` and `zmax` Defaults to `false` when `zmin` and `zmax` are set by the user.
zhoverformat
Sets the hover text formatting rulefor `z` using d3 formatting mini-languages which are very similar to those in Python. For numbers, see: https://github.com/d3/d3-format/tree/v1.4.5#d3-format.By default the values are formatted using generic number format.
zmax
Sets the upper bound of the color domain. Value should have the same units as in `z` and if set, `zmin` must be set as well.
zmid
Sets the mid-point of the color domain by scaling `zmin` and/or `zmax` to be equidistant to this point. Value should have the same units as in `z`. Has no effect when `zauto` is `false`.
zmin
Sets the lower bound of the color domain. Value should have the same units as in `z` and if set, `zmax` must be set as well.
zsmooth
Picks a smoothing algorithm use to smooth `z` data.
zsrc
Sets the source reference on Chart Studio Cloud for `z`.
AUTHOR
Pablo Rodríguez González <pablo.rodriguez.gonzalez@gmail.com>
COPYRIGHT AND LICENSE
This software is Copyright (c) 2022 by Pablo Rodríguez González.
This is free software, licensed under:
The MIT (X11) License