NAME
PDL::Graphics::Prima - an interactive plotting widget and library for PDL and Prima
SIMPLE SYNOPSIS
use PDL::Graphics::Prima::Simple;
use PDL;
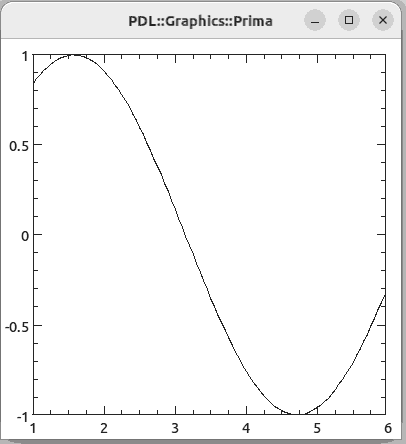
# --( Super simple line and symbol plots )--
# Generate some data - a sine curve
my $x = sequence(100) / 20 + 1;
my $y = sin($x);
# Draw x/y pairs. Default x-value are sequential:
line_plot($y); line_plot($x, $y);
circle_plot($y); circle_plot($x, $y);
triangle_plot($y); triangle_plot($x, $y);
square_plot($y); square_plot($x, $y);
diamond_plot($y); diamond_plot($x, $y);
X_plot($y); X_plot($x, $y);
cross_plot($y); cross_plot($x, $y);
asterisk_plot($y); asterisk_plot($x, $y);
# Sketch the sine function for x initially from 0 to 10:
func_plot(0 => 10, \&PDL::sin);
# --( Super simple histogram )--
# PDL hist method returns x/y data
hist_plot($y->hist);
my ($bin_centers, $heights) = $y->hist;
hist_plot($bin_centers, $heights);
# Even simpler, if of limited use:
hist_plot($heights);
# --( Super simple matrix plots )--
# Generate some data - a wavy pattern
my $image = sin(sequence(100)/10)
+ sin(sequence(100)/20)->transpose;
# Generate a grayscale image:
matrix_plot($image); # smallest is white
imag_plot($image); # smallest is black
# Set the x and y coordinates for the image boundaries
# left, right, bottom, top
matrix_plot([ 0, 1 ], [ 0, 2 ], $image);
imag_plot( [ 0, 1 ], [ 0, 2 ], $image);
# --( More complex plots )--
# Use the more general 'plot' function for
# multiple DataSets and more plotting features:
my $colors = pal::Rainbow()->apply($x);
plot(
-lines => ds::Pair($x, $y,
plotType => ppair::Lines
),
-color_squares => ds::Pair($x, $y + 1,
colors => $colors,
plotType => ppair::Squares(filled => 1),
),
x => 'Time',
y => {
label => 'Sine',
scaling => sc::Log,
},
);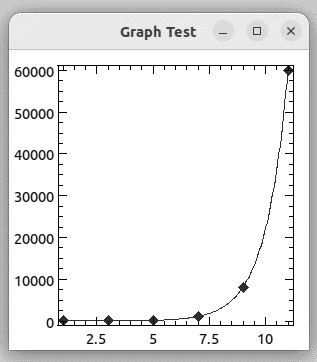
WIDGET SYNOPSIS
use PDL;
use Prima qw(Application);
use PDL::Graphics::Prima;

my $t_data = sequence(6) / 0.5 + 1;
my $y_data = exp($t_data);

my $wDisplay = Prima::MainWindow->create(
    text  => 'Graph Test',
    size  => [300, 300],
);

$wDisplay->insert('Plot',
    -function => ds::Func(\&PDL::exp, color => cl::Blue),
    -data => ds::Pair($t_data, $y_data, color => cl::Red),
    pack => { fill => 'both', expand => 1},
);

run Prima;
IF YOU ARE NEW
If you are new to PDL::Graphics::Prima, you should begin by reading the documentation for PDL::Graphics::Prima::Simple. This module provides a simplified interface for quickly dashing off a few plots and offers stepping stones to create more complex plots. Often, the simple interface is sufficient for my simple plotting needs. However, PDL::Graphics::Prima is actually a widget in the Prima GUI toolkit. If you find that you need to interact more directly with your data and its visualization, you can build stand-alone GUI applications with the necessary interaction.
The documentation in this file explains how to use PDL::Graphics::Prima as a plotting widget.
DESCRIPTION
PDL::Graphics::Prima is a plotting library for 2D data visualization. The core of this library is a Plot widget that can be incorporated into Prima applications. The library produces publication quality static figures, but its true potential lies in using it as a component in a GUI application. Prima provides an array of useful interactive widgets and a simple but powerful event-based programming model. PDL::Graphics::Prima provides a sophisticated plotting library within this GUI framework, letting you focus on what you want to visualize rather than the details of how you would draw it. These tools allow you to build interactive data visualization and analysis applications with sophisticated plotting and intuitive user interaction in only a few hundred lines of code.
Like any other widget, a Plot widget can be constructed using the parent widget's insert method. PDL::Graphics::Prima actually defines the bulk of its functionality in the Prima::Plot package, so that you can simply say:
$parent->insert(Plot =>
    place => {
        x => 0, relwidth => 0.5, anchor => 'sw',
        y => 0, relheight => 0.5,
    },
    -data => ds::Pair($t_data, $y_data, color => cl::Red),
    ... etc ...
);
Prima::Plot (i.e. PDL::Graphics::Prima) is a descendant of the Prima::Widget class, so everything that you can do with widgets you can do with plots, including specifying event callbacks such as mouse and keyboard interaction. You can specify the means for placing the plot within a larger parent widget using basic geometry management, or the Tk-like pack or place specifiers. In fact, Prima allows any widget to serve as the container for other widgets, so you can insert other widgets (i.e. other plots) into a plot. This is how you create figure insets.
If you want to add new content to a plot or remove content from a plot, you do this by manipulating the dataSet collection. Axis minima, maxima, scaling, and labels are handled by axis objects which you obtain through the x and y axis accessors. You set and manipulate the title via the title accessor method.
From the standpoint of basic plot object structure, that's about it!
Properties
PDL::Graphics::Prima has a number of properties that you can specify in the constructor and later change through accessor methods.
title
Sets or gets the string with the figure's title text. To remove an already set title, specify an empty string or the undefined value. Changing this issues a ChangeTitle event.
titleFont
Sets or gets a set of key/value pairs that indicate how the title font should differ from the widget's font. For example, if you want to have your plot title rendered in Arial but have all other font properties the same, you could say
$plot->titleFont( name => 'Arial' );If you later want to set the style to underlined, you could say this:
$plot->titleFont( $plot->titleFont, style => fs::Underlined );Notice that I call $plot->titleFont as an argument to the method. This ensures that the font formatting I have already specified (the Arial font name) is not wiped out with the font update.
In addition to the normal font properties (as discussed in the Fonts section of Prima::Drawable, there are also a couple of important extensions for sizes that I have implemented explicitly for title fonts. You can specify dynamic font height, size, and width using strings with special suffixes. These suffixes include:
<number>%height
<number>%width
<number>x
The %height suffix will compute the height, width, or size to be a percentage of the widget's height, so if you widget is 100 pixels tall, a height specification of 10%height will cause your font height to be 10 pixels. If you resize your widget to 200 pixels, the title height will automatically scale to 20 pixels. The third specification specifies a multiple of the widget's font value, so a height of 1.5x will be 1.5 times higher than the widget's default font size. This way, if you change the size of the font (and therefore the axis label and tick label sizes), your title font will automatically adjust, too.
The default titleFont is height => '10%height'.
Note that Prima's font system does not allow for arbitrary font sizes, so if you pick a font size of 18 pixels, it may only be able to find a means for rendering the font as 19 pixels. But usually, Prima can get pretty close.
titleSpace
Sets or gets the titleSpace property for the plot widget. You can set the titleSpace property with an integer, a subref, a string, or a hashref. The string will be parsed into a hashref, so the return value when you query this property as a getter is going to be an integer, a subref, or a hashref.
If you specify an integer, that will be the number of pixels used to display the title. This requires the fewest calculations when rendering, and makes sense if you set the font's height or size to an explicit value rather than a dynamic one. But this is also the least adaptable way to specify the titleSpace. You could use this as
$plot->titleSpace(50);On the other extreme, you can specify a subref. The subref should accept the widget as its sole argument and compute and return the titleSpace dynamically. For example:
# Set the titleSpace to be the square root of the widget height
$plot->titleSpace( sub {
    my $widget = shift;
    return sqrt($widget->height);
});
In the middle, you can specify a dynamic titleSpace with a string representing a sum of values with special units. An example of such a string looks like this:
$plot->titleSpace('5% + 1line - 10pixels')This would lead to a dynamic height of 5% of the canvas height plus the font height less 10 pixels. You could also specify this with a hashref of
$plot->titleSpace({
    canvas_percent => 0.05,
    lines          => 1,
    pixels         => -10,
});
Notice that negative and positive values are allowed, and it is quite possible that your dynamic calculation will end up with a net negative value (which is not allowed if you specify a bare integer number of pixels). So, if your title is just not visible, it may be because you have a faulty titleSpace specification.
The default titleSpace is 1line.
Note that although string specifications are parsed only once (into a hashref representation), these dynamic sizes lead to more calculations than a bare pixel height or subref. If your goal is to have a title with fast rendering times, which can be important for animations, you should probably avoid dynamic sizes.
x, y
Obtains the object that controls the settings for the x- or y-axis. For example:
# Set the x-min to -10 and the y-max to auto-scaling
$plot->x->min(-10);
$plot->y->max(lm::Auto);
Actually, these accessors are not hard-coded into the plot library. Rather, these are the default names of the axes. Any object of type Prima::Component (which is any object in the Prima object hierarchy) that has a name can be accessed from the parent by using the component's name as a method on the parent. That is, you can change the name of the axis and use the new name:
# Rename the x-axis; be sure it starts with "x", though
$plot->x->name('xfoo');
# Change the x-axis' minimum value
$plot->xfoo->min(-10);
# This croaks:
$plot->x->max(20);
This is a feature of Prima. Eventually, when multiple x- and y-axes are allowed, this will allow you to transparently access them by name just like you can access the single x- and y-axes by name at the moment.
dataSets
This is the means by which you add new content to your plot (apart from placing sub-figures in there, of course). This either sets or returns the collection of DataSets. The DataSets are held in a tied anonymous hash that you directly manipulate. In order to add a new DataSet, you can simply modify the anonymous hash in place using standard Perl hash manipulation functions and techniques. For example:
# Add a new DataSet
$plot->dataSets->{new_data} = ds::Pair(
    $x, $y, plotType => ppair::Squares
);

# Remove a DataSet
delete $plot->dataSets->{model};

# Clear the DataSets
%{$plot->dataSets} = ();
Since the hash is actually tied, DataSets that you add will be validated as you add them.
METHODS
PDL::Graphics::Prima provides a number of methods. Most of these focus on generating images of the plot.
get_image
Returns a Prima::Image of the plot with same dimensions as the plot widget.
save_to_postscript
Saves the plot with current axis limits to an encapsulated postscript figure or to a PDF file. This method takes an optional filename argument. If no filename is specified, it pops-up a dialog box to ask the user where and under what name they want to save the figure.
This functionality will likely be merged into save_to_file, though this method will remain for backwards compatibility.
save_to_file
Saves the plot to a raster image file. This method takes an optional filename argument, deducing the format (and applicable codec) from the filename. If no filename is specified, it creates a dialog box asking the user where and under what name they want to save the file.
copy_to_clipboard
Copies the plot with current axis limits as a bitmap image to the clipboard. The resulting clipboard entry is suitable for pasting into applications that know how to handle bitmap images such as LibreOffice or gpaint on Linux, Microsoft Office or Windows Paint on Windows.
Events
You can send notifications and hook callbacks for the following events:
ChangeTitle
Called when the title or titleSpace gets changed
Replot
Called when the widget needs to replot "real soon", but not immediately. Immediate replot requests should go in the form of "Paint" events. In order to prevent the system from getting bogged down by too many paint requests, replotting kicks off a timer that issues the paint requests after a brief period (defaults to 30 milliseconds).
ChangeData
Called when the dataSet container changes (not the datasets themselves, but the whole container).
DRAWING A PLOT TO AN IMAGE
Most methods that are not properties provide means for generating images from a plot. Sometimes it is useful to draw a plot on a pre-formed image. Let's look at the different mechanisms for doing this.
For a point of comparison, if you simply want a raster image object from a plot, you should simply obtain it from the plot object with the get_image method:
my $image = $plot->get_image;However, what if you already have an image object upon which you want to draw your plot? There are at least two circumstances when you might want to do this: first if you are creating many raster images from plots and want to avoid memory re-allocations, and second if you have in image with some annotations on it already. (Beware the first reason: it is likely a premature optimization.) To draw the plot on an already-formed image, you can use the paint_with_widgets method like so:
$some_image->begin_paint;
$some_image->clear;
... other painting here ...
$plot->paint_with_widgets($some_image);
... more painting ...
$some_image->end_paint;
The paint_with_widgets method is the preferred way to draw a plot onto a pre-existing image. It gives you a bit more control on how the painting is invoked: for example, it does not clear the canvas for you. But with the increased control comes increased manual manipulation: you need to set the image in the paint-enabled state before invoking it, and you need to clear the canvas before getting started.
There is one more means for rendering a plot on an image, which arises if you are invoking the Paint Event from an arbitrary widget into a canvas. In that case, you should be able to say this:
$some_widget->notify('Paint', $some_image);
# This will set up a notification, which will not process
# until the next tick in the event loop. If you need the
# image to be updated immediately, invoke a tick:
$::application->yield;
Painting on an image by invoking the Paint Event is similar to the paint_with_widgets method, but it also ensures that your image is in a paint-enabled state, clears the canvas, and returns the image in a paint-disabled state if that's how it started. This is usually what you want and expect when invoking the Paint event on a canvas.
Caveat: Fonts
Font handling is one of the areas in PDL::Graphics::Prima that is slated to see some improvement. Until that happens, you will notice that the font size in your output image is probably not quite what you expect, and if you change the font face, that may not match, either. To fix the font issues for now, you can set your image's font attributes based on the widget's, either at image construction time:
$image = Prima::Image->new(
  width => $width,
  height => $height,
  font => $plot->font,
);
or later with the font setter:
$image->font($plot->font);TODO
This is not a perfect plotting library. Here are some of the particularly annoying issues with it, which I hope to resolve. This is part warning to you, gentle reader, and part task list for me.
If Prima had an SVG output, I could easily add it as a figure output option.
I have had it on my list for a while to add the facilities to turn off drawing operations, temporarily, so that adding a large number of dataSets can be done more quickly. This would require some sort of interface such as
$plot->autoupdate(0);
... add datasets ...
$plot->autoupdate(1);
I have hit substantial performance problems when adding over 20 datasets. The actual drawing of those datasets and mouse interaction is fine, but the process of just adding them to the plot can be quite sluggish.
The exact pixel position of the left margin depends on the size of the y-tick labels, which can change during the process of zooming in or out. This means mouse scroll-wheel action doesn't work exactly as advertised. Well, it does, now that I've hedged my advertisement. Still, tracking the previous time of a scroll wheel click and the previous x/y location could make it work flawlessly.
There is no way to indicate by-hand where the viewport should be. It is always calculated from the requirements of the tick labels. There is no way to control the padding on the right side of the plot, either; it is fixed. All of these should be tweakable.
Singular names => scalars, plural names => piddles is not consistent across the board. At least not with all of the plotTypes. This can be fixed by changing singular keys to plurals and quietly accepting singulars for backwards compatibility, but it hasn't happened yet.
Multiple axes. In the constructor, any property that starts with x would be an x-axis (x1, x2, etc). You would have to specify an axes with a dataset, though the default would be the first axis when sorted asciibetically. Axes would have properties regarding if they are drawn on the top, the bottom, both, etc, and whether their tick labels are drawn on the top, bottom, etc.
I am very proud of the automatic scaling. Unfortunately, it's complicated and not yet well documented. Also, it could be even more awesome. It needs to allow for negative pixel paddings as well as "extra" pixel padding. This would simply effect how collate_min_max_for_many works and should be a snap to implement. For what it's worth, the collation code should probably be rewritten in C.
Automatic scaling should allow for 'next widest tick' in addition to the current super-tight bounds that it calculates. This would make hard-copy figures much, much nicer.
SEE ALSO
Both the Perl Data Language and the Prima GUI Toolkit are amazing and this module would have no reason for existence without both of them.
This module serves as the motivation for PDL::Drawing::Prima, and also would be unable to function with any efficiency without it.
Other 2D plotting options include PDL::Graphics::PGPLOT, PDL::Graphics::PLplot, PDL::Graphics::Gnuplot. There may be a few others. For my part, I also wrote PDL::Graphics::Asymptote, though it is more of a toy than these other libraries. Search CPAN for more.
For 3D plotting, see PDL's own PDL::Graphics::TriD, as well as PDL::Graphics::Gnuplot and the low-level bindings in PDL::Graphics::PLplot.
AUTHOR
David Mertens (dcmertens.perl@gmail.com)
ADDITIONAL MODULES
Here is the full list of modules in this distribution:
- PDL::Graphics::Prima
-
Defines the Plot widget for use in Prima applications
- PDL::Graphics::Prima::Axis
-
Specifies the behavior of axes (but not the scaling)
- PDL::Graphics::Prima::DataSet
-
Specifies the behavior of DataSets
- PDL::Graphics::Prima::Limits
-
Defines the lm:: namespace
- PDL::Graphics::Prima::Palette
-
Specifies a collection of different color palettes
- PDL::Graphics::Prima::PlotType
-
Defines the different ways to visualize your data
- PDL::Graphics::Prima::ReadLine
-
Encapsulates all interaction with the Term::ReadLine family of modules.
- PDL::Graphics::Prima::Scaling
-
Specifies different kinds of scaling, including linear and logarithmic
- PDL::Graphics::Prima::Simple
-
Defines a number of useful functions for generating simple and not-so-simple plots
- PDL::Graphics::Prima::SizeSpec
-
Compute pixel distances from meaningful units
LICENSE AND COPYRIGHT
Unless otherwise stated, all contributions in code and documentation are copyright (c) their respective authors, all rights reserved.
Portions of this module's code are copyright (c) 2011 The Board of Trustees at the University of Illinois.
Portions of this module's code are copyright (c) 2011-2013 Northwestern University.
Portions of this module's code are copyright (c) 2013-2014 Dickinson College.
This module's documentation is copyright (c) 2011-2014 David Mertens.
This module is free software; you can redistribute it and/or modify it under the same terms as Perl itself.