NAME
PDL::Graphics::Prima::Axis - class for axis handling
SYNOPSIS
use PDL;
use PDL::Graphics::Prima::Simple;
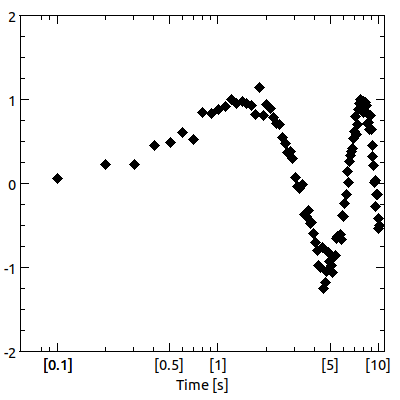
# Specify details for an axis during plot construction:
my $x = sequence(100)/10 + 0.1;
my $y = $x->sin + $x->grandom / 10;
my $plot = plot(
-data => ds::Pair($x, $y),
# Details for x-axis:
x => {
# Scaling can be either sc::Log or sc::Linear (the default)
scaling => sc::Log,
# Labels are optional:
label => 'Time [s]',
format_tick => sub {
sprintf("[%g]", $_[0])
},
},
# Details for y-axis:
y => {
# explicitly specify min/max if you like
min => -2,
max => 2,
onChangeLabel => sub {
my $self = shift;
print "You changed the label to ", $self->label, "\n";
},
},
);
# Get the x-max and inquire if it's autoscaling:
my ($x_min, $is_auto) = $plot->x->min;
# Set the current y-min to -5:
$plot->y->min(5);
# Turn on x min autoscaling:
$plot->x->min(lm::Auto);
# Stop autoscaling, use the current max (deprecated):
$plot->x->max($plot->x->max);
# Note: All changes to min/max values
# fire the ChangeBounds notification
# Get the x-label:
my $x_label = $plot->x->label;
# Set the x-label:
$plot->x->label('new_label');
# Note: All changes to the label
# fire the ChangeLabel notification
# Conversion among real, relative, and pixel positions,
# useful for plotType drawing operations
my $x_rels = $plot->x->reals_to_relatives($x);
my $xs = $plot->x->relatives_to_reals($x_rels);
my $x_pixels = $plot->x->relatives_to_pixels($x_rels);
$x_rels = $plot->x->pixels_to_relatives($x_pixels);
$x_pixels = $plot->x->reals_to_pixels($xs);
$xs = $plot->x->pixels_to_reals($x_pixels);
# Get the current scaling object/class:
my $x_scaling = $plot->x->scaling;
# Set the current scaling object/class:
$plot->x->scaling(sc::Log);
# Note: All changes to the scaling
# fire the ChangeScaling notification
line_plot($x, $y);DESCRIPTION
PDL::Graphics::Prima handles the axes with full Prima objects for both the x- and the y-axes. Although the current implementation is not terribly flexible, it is still quite useful and poweful, and ripe for extensions and improvements.
The axis objects manage a number of different functions and capabilities. They keep track of their own minimum and maximum values, for example, as well as the axis labels. They are also responsible for drawing tick marks, tick labels, and axis labels during plot drawing operations. It should be noted, however, that the scaling object or class is responsible for determining the tick locations.
Axes provide the mechanism for converting data coordinates to pixel coordinates, and vice versa.
One of the more subtle issues involved with axes is that they are responsible for reporting the space they need for their tick and axis labels. These calculations help ensure that numbers do not get clipped simply because they do not have enough space (although the functionality could be improved).
Properties
min, max
Gets/sets the the individual extrema. The return value depends upon the calling context. If requested in scalar context, you simply get the current calculated extreme value. If requested in list context, you get two return values, the first being the extremum and the second being a boolean value indicating whether or not the Auto flag is set.
minmax
Pair accessor. You can set the min/max values in one shot with this function, and you will get a two-element list if you call it as a getter. For example:
my $piddle = get_data;
$graph_widget->x->minmax($piddle->minmax);

# ...

print "The x min/max values are ", join(', ', $graph_widget->x->minmax), "\n";
Note that if you are setting both the min and the max to autoscaling, calling minmax(lm::Auto, lm::Auto) is faster than calling min(lm::Auto) followed by max(lm::Auto).
scaling
Gets or returns the axis' scaling object. You can change the scaling using this example with something like this:
# Switch to logarithmic scaling:
$widget->x->scaling(sc::Log);
Note, however, that some scalings allow values that are not permissible in others. For example, Linear scaling allows negative values but Logarithmic scaling does not. At the moment, if you try to switch to Logarithmic scaling without ensuring that the current min and max are positive, this will die telling you that negative values are not allowed.
For more details about scaling, see PDL::Graphics::Prima::Scaling.
label
Gets or sets the axis' label. You can remove the label by passing an empty string or by explicitly passing an undefined value. Adding a label will cause the viewing rectangle to shrink so that your widget can accomodate the label dimensions.
NOTIFICATIONS
Axis widgets provide a handful of notifications that are useful for handling user or other interaction.
ChangeBounds
This event is fired immediately after the bounds are changed, whether the change is due to the user's mouse interaction or by a setter call of min, max, or "minmax".
ChangeScaling
This event is fired immediately after the axis' scaling type is changed (i.e. from linear to logarithmic).
ChangeLabel
This event is fired immediately after setting, changing, or removing the axis' label.
METHODS
reals_to_relatives, relatives_to_reals
Signature: $axis->reals_to_relatives($data, [$min, $max])Converts real values (i.e. numbers in the set of reals, as opposed to the set of complex numbers, or integers) to their relative pixel positions within the plot window, where by relative, I mean the result is a number between 0 and 1. This takes the scaling (logarithmic, linear, etc) into account. The min and the max are optional and the axis's min and max values will be used if a min and max are not supplied.
Actually, it can be less than 0 or greater than 1. If you have a real number that is less than the plot's minimum value, it will have a negative relative value, and if you have a real number that is greater than the plot's maximum value, it will have a relative number greater than 1. This is probably better understood through a few examples.
Suppose your graph has a min/max of 0 and 100. For linear scaling, a value of 50 would have a relative position of 0.5, a value of 10 would have a relative position of 0.1, 200 would have a relative position of 2, and -10 would have a relative position of -0.1.
If you do not provide a min or a max value, the axis's current min and max are used by default.
pixels_to_relatives, relatives_to_pixels
Converts relative plot positions to their on-widget pixel locations. The widget's pixel origin is taken to be zero at the lower left corner of the widget, so this both rescales the numbers and includes the appropriate offset.
reals_to_pixels, pixels_to_reals
A convenience function to convert real values directly to on-widget pixel locations. This simply combines the previous two documented functions.
draw
Draws the axis, including the bounding box, ticks, and tick labels
update_edges
Updates the cached edge data and initiates a recomputation of the autoscaling, if appropriate. This is usually triggered by a window resize, a new or modified dataset, or a label change, and it does not change
This function's semantics (or even its presence) is likely to change in the future, so do not depend on its behavior unless you are willing to keep on top of updates to this library.
recalculate_edge_requirements
Calculates the edge requirements to draw tick labels based on the current min/max. This does not initiate an autoscaling recalculation, precisely because it is meant to be used within that calculation. An identical calculation is performed during drawing operations (though that may change in the future).
TODO
- better autoscaling for function datasets
-
The ds::Func dataset does not get proper y-axis spacing. This needs to be figured out an fixed.
- tick customization
-
Lots more customization, including inward vs outward tick marks, more automatic tick algorithms (including customizable ticks), or even no ticks. Actually, the tick algorithms are controlled by the Scaling object/class, not the Axis class. But still. Other tick properties, like the font size and style, need to be adjustable.
- hard minima/maxima
-
Add abs_min, abs_max, etc, which means "*Never* make this axis less than than (or greater than) specified value.
- multiple axes
-
Allow for multiple x- and y-axes. This is likely to impact PDL::Graphics::Prima more than this module, but the upshot is that instead of calling an axis
xory, any key prefixed withxorywould be assumed to be an axis specification. This way, you could have:plot( ... x_power => axis::log('x' , on => 'bottom' , label => 'Power (W)' , x_decibels => sub { # computes the decibels when the min/max Power is changed: my ($self, $power) = @_; # Assume a normalizatin of 1 Watt: return log($power)/log(10); }, ), x_decibels => axis::linear('x' , on => 'top' , label => 'Decibels (dB)' , x_intensity => sub { # Computes the power when the min/max decibels are changed: my ($self, $decibels) = @_; return 10**$decibels; }, ), );This would have logarithmic Power scaling tick marks on the bottom axis and linear Decibel scaling tick marks on the top, with proper conversion functions so that if the min or max of one changes, the min/max of the other is properly changed as well. However, this code sketch suggests an interface that is far from finalized, and the implementation details (especially regarding autoscaling and collation) will require some major work in order to make this function correctly.
- special drawing
-
When drawing, I need to have the axes query the Scaling to see if any special drawing needs to happen. I am thinking at the moment about broken axes.
- better high-zoom handling
-
Right now when a user zooms in very narrowly on some nonzero region, the tick labels get longer and longer. It would be nice to have some graceful way of only displaying the significant digits. For example, rather than tick labels of 12.279850. 12.279855, 12.279860, 12.279865, and 12.279870, perhaps the *axis* label could say "<thing> as 12.2798xx <units>" and then the tick labels would just be 50, 55, 60, 65, and 70. This, again, would require some interaction with the scaling to know what to do. Also, it would be difficult to get this to play nicely with the format_tick capabilities just added.
AUTHOR
David Mertens (dcmertens.perl@gmail.com)
ADDITIONAL MODULES
Here is the full list of modules in this distribution:
- PDL::Graphics::Prima
-
Defines the Plot widget for use in Prima applications
- PDL::Graphics::Prima::Axis
-
Specifies the behavior of axes (but not the scaling)
- PDL::Graphics::Prima::DataSet
-
Specifies the behavior of DataSets
- PDL::Graphics::Prima::Limits
-
Defines the lm:: namespace
- PDL::Graphics::Prima::Palette
-
Specifies a collection of different color palettes
- PDL::Graphics::Prima::PlotType
-
Defines the different ways to visualize your data
- PDL::Graphics::Prima::ReadLine
-
Encapsulates all interaction with the Term::ReadLine family of modules.
- PDL::Graphics::Prima::Scaling
-
Specifies different kinds of scaling, including linear and logarithmic
- PDL::Graphics::Prima::Simple
-
Defines a number of useful functions for generating simple and not-so-simple plots
- PDL::Graphics::Prima::SizeSpec
-
Compute pixel distances from meaningful units
LICENSE AND COPYRIGHT
Unless otherwise stated, all contributions in code and documentation are copyright (c) their respective authors, all rights reserved.
Portions of this module's code are copyright (c) 2011 The Board of Trustees at the University of Illinois.
Portions of this module's code are copyright (c) 2011-2013 Northwestern University.
Portions of this module's code are copyright (c) 2013-2014 Dickinson College.
This module's documentation is copyright (c) 2011-2014 David Mertens.
This module is free software; you can redistribute it and/or modify it under the same terms as Perl itself.