NAME
Chart::GGPlot - ggplot2 port in Perl
VERSION
version 0.002003
STATUS
At this moment this library is experimental and still under active development (at my after-work time). It's still quite incomplete compared to R's ggplot2 library, but the core features are working.
SYNOPSIS
use Chart::GGPlot qw(:all);
use Data::Frame::Examples qw(mtcars);

my $plot = ggplot(
    data => mtcars(),
    mapping => aes( x => 'wt', y => 'mpg' )
)->geom_point();

# show in browser
$plot->show;

# export to image file
$plot->save('mtcars.png');

# see "examples" dir of this library's distribution for more examples.
DESCRIPTION
This Chart-GGPlot library is an implementation of ggplot2 in Perl. It's designed to be possible to support multiple plotting backends. And it ships a default backend which uses Chart::Plotly.
This Chart::GGPlot module is the function interface of the Perl Chart-GGPlot library.
Example exported image files:
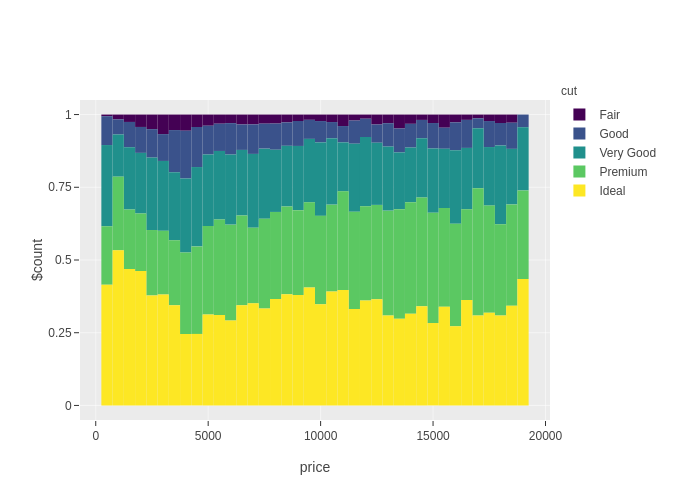
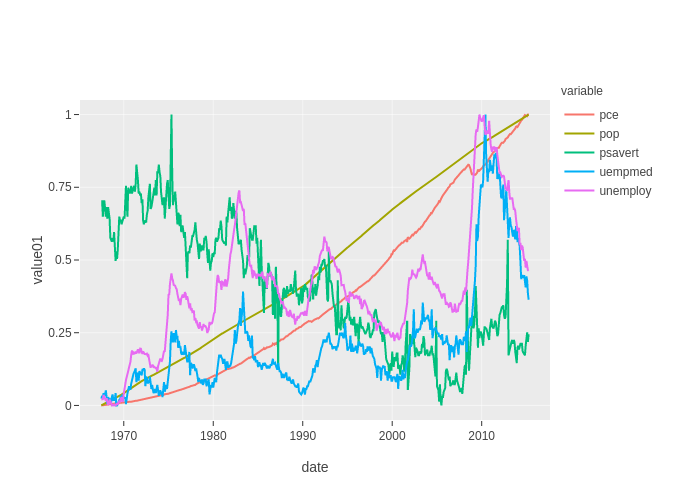
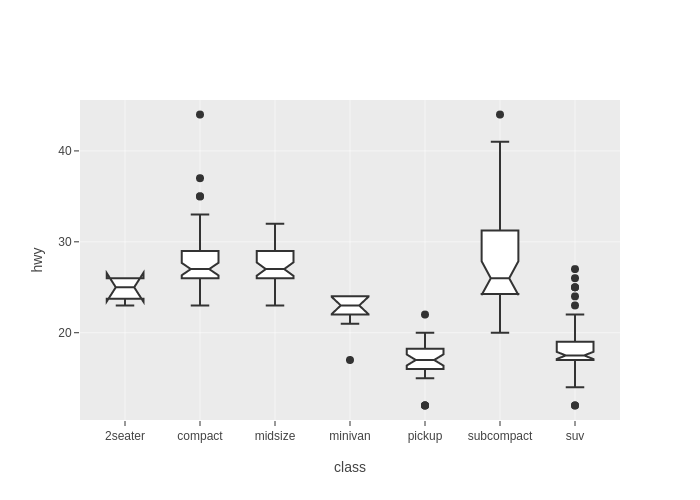
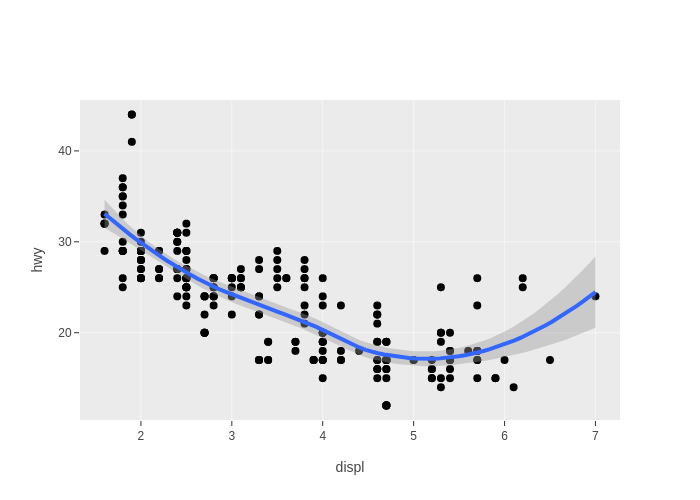
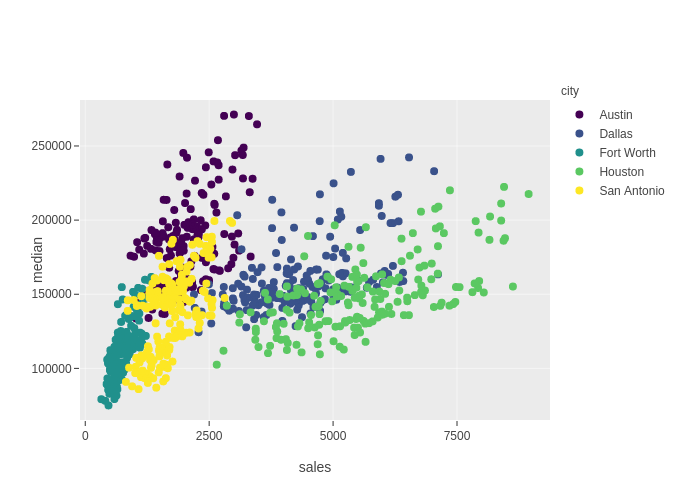
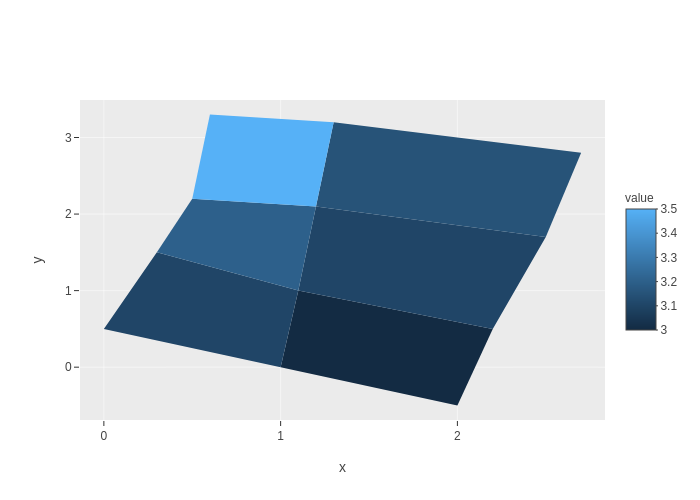
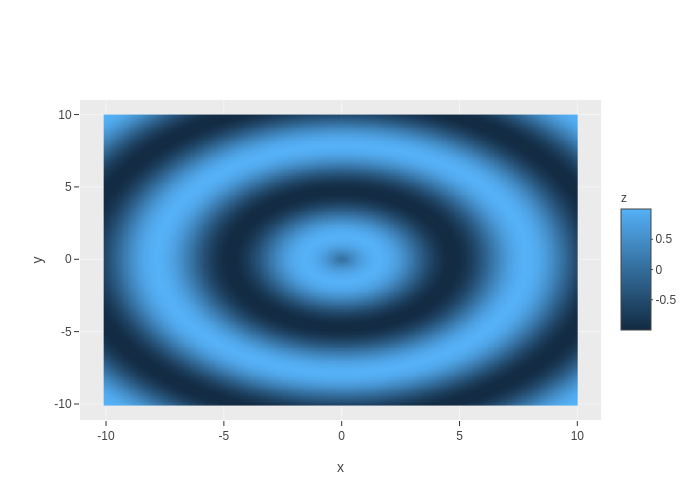
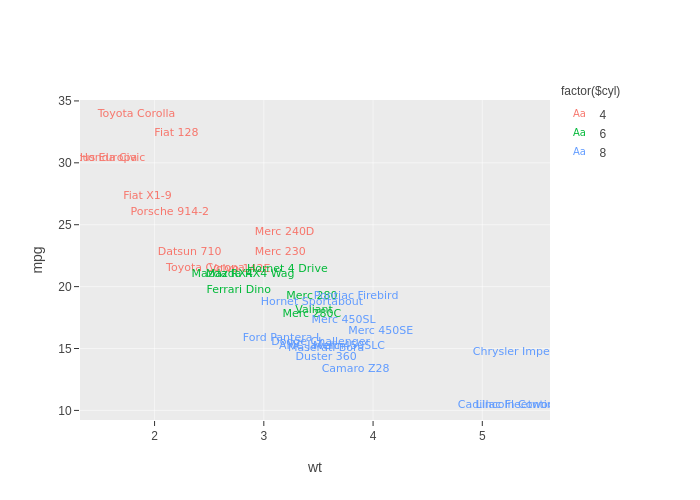
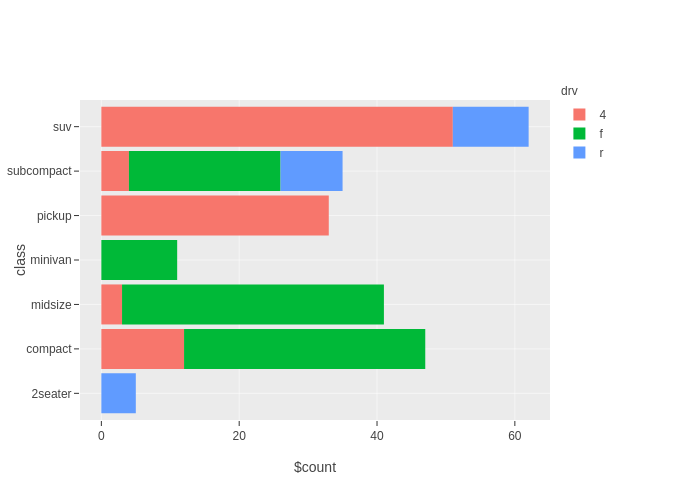
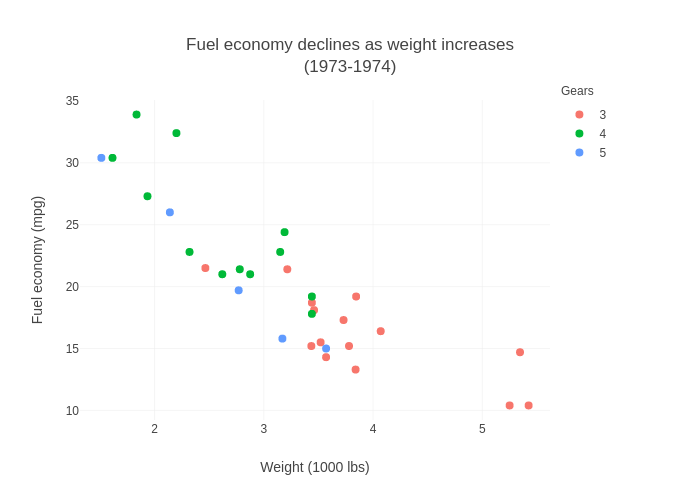
See the examples dir in the library's distribution for more examples.
Document Conventions
Function signatures in docs of this library follow the Function::Parameters conventions, for example,
myfunc(Type1 $positional_parameter, Type2 :$named_parameter)FUNCTIONS
ggplot
ggplot(:$data, :$mapping, %rest)This is same as Chart::GGPlot::Plot->new(...). See Chart::GGPlot::Plot for details.
qplot
qplot((Piddle1D|ArrayRef) :$x, (Piddle1D|ArrayRef) :$y,
    Str :$geom='auto',
    :$xlim=undef, :$ylim=undef,
    Str :$log='',
    Maybe[Str] :$title=undef, Str :$xlab='x', Str :$ylab='y',
    %rest)
Arguments:
$x, $y
Data. Supports either 1D piddles or arrayrefs. When arrayref is specified, it would be converted to either a numeric piddle or a PDL::SV piddle, guessing by its contents.
$geom
Geom type.
"auto"is treated as'point'. It would internally call ageom_${geom}function.$xlim, $ylim
Axes limits.
$log
Which axis use logarithmic scale? One of
'','x','y','xy'.$title
Plot title. Default is
undef, for no title.$xlabel, $ylabel
Axes labels.
ENVIRONMENT VARIABLES
CHART_GGPLOT_TRACE
A positive integer would enable debug messages.
SEE ALSO
AUTHOR
Stephan Loyd <sloyd@cpan.org>
CONTRIBUTOR
Pablo Rodríguez (pablrod)
COPYRIGHT AND LICENSE
This software is copyright (c) 2019-2023 by Stephan Loyd.
This is free software; you can redistribute it and/or modify it under the same terms as the Perl 5 programming language system itself.